Article Text

Abstract
Objectives The reliability of ultrasonic strain elastography (SEL) used to detect abnormalities in the supraspinatus tendon is unclear. Thus, the aim of this study was to investigate the reliability of SEL in the supraspinatus tendon.
Design An intra-rater and inter-rater reliability study.
Setting A single-centre study conducted at the University of Southern Denmark.
Participants Twenty participants with shoulder pain and MRI-verified supraspinatus tendinosis and 20 asymptomatic participants (no MRI).
Primary and secondary outcome measures Raw values (RAW) and ratios (deltoid muscle (DELT) and gel pad (GEL) as reference tissues) were calculated and mean values of measurements from three regions of the supraspinatus tendon were reported. Colour scale ratings and number of yellow/red lesions from the three areas were also included.
Results Intra-rater reliability showed intraclass correlation coefficients (ICCs) for RAW, DELT and GEL: 0.97 (minimal detectable change (MDC): 0.28 (6.36% of the mean)), 0.89 (MDC: 2.91 (20.37%)) and 0.73 (MDC: 1.61 (58.82%)), respectively. The ICCs for inter-rater reliability were 0.89 (MDC: 0.47 (10.53%)), 0.78 (MDC: 3.69 (25.51%)) and 0.70 (MDC: 1.75 (62.63%)), respectively.
For colour scale ratings, intra-rater reliability (linear weighted kappa) ranged from 0.76 to 0.79, with the inter-rater reliability from 0.71 to 0.81. For the number of lesions, intra-rater reliability ranged from 0.40 to 0.82 and inter-rater reliability from 0.24 to 0.67.
Conclusions Intra-rater and inter-rater reliability were excellent for raw values and for ratios with deltoid muscle as the reference tissue, and good for ratios with gel pad as the reference tissue. The reliability of colour scale ratings was substantial-to-almost perfect, and for the number of lesions fair-to-almost perfect.
Although high reliability was found, validity and responsiveness of these elastographic methods needs further investigation.
Ethics approval The study protocol was approved by the Ethics Committee for the Region of South Denmark (S-20160115) and reported to the Danish Data Protection Agency (2014-41-3266).
- strain elastography
- supraspinatus tendon
- rotator cuff
- tendon quality
- reliability
- tendinopathy
This is an open access article distributed in accordance with the Creative Commons Attribution Non Commercial (CC BY-NC 4.0) license, which permits others to distribute, remix, adapt, build upon this work non-commercially, and license their derivative works on different terms, provided the original work is properly cited, appropriate credit is given, any changes made indicated, and the use is non-commercial. See: http://creativecommons.org/licenses/by-nc/4.0/.
Statistics from Altmetric.com
Strengths and limitations of this study
Standardised procedure for capturing strain elastographic images was developed and applied.
Raw values of strain elastographic images were presented.
Ratios, based on different reference tissues or areas (deltoid muscle/gel pad), of strain elastographic images were calculated and presented.
Specific procedures for colour grading strain elastographic images were presented.
Strain elastography is highly operator-dependent which may limit the external validity.
Introduction
Shoulder pain is a common symptom, with a lifetime prevalence in the general population of 6.7% to 66.7%1 and subacromial pain syndrome is the second most common cause of pain in the shoulder.2 Shoulder pain has consequences such as physical limitations, mental problems3 and absence from work.4
Shoulder disorders are evaluated by history-taking and physical examination, potentially supplemented with X-ray, conventional ultrasound and/or MRI. However, supraspinatus tendon abnormalities are also found in asymptomatic people when using general modalities such as MRI and ultrasound.5 Furthermore, it seems difficult to distinguish pathological changes from healthy tissues by using conventional ultrasound because pathological regions often exhibit the same echogenicity as non-pathological regions.6
Strain elastography (SEL) is a relatively new and not yet well-established method, which may assist in diagnosis, prediction and monitoring of progress in tendon healing.7
SEL defines the physical properties of soft tissues through characterisation of the differences in stiffness between ‘the regions of interest’ (ROI) and the surrounding tissues.8 9 Conventional ultrasound and MRI were developed for visualisation of macroscopic changes and not specifically for the mechanical tendon properties, which is why SEL may add further knowledge to conventional shoulder imaging. Since tendon quality is a prognostical factor for rotator cuff repair, information about tendon stiffness could be beneficial for the surgeon.10
Tissue deformation using SEL is obtained by uniform mechanically-induced compressions (strain) of the structures under the ultrasound transducer, during the ultrasound scan. Through manual compression, the soft tissue deforms differently depending on its inherent stiffness. The degree of deformation can be interpreted as an estimate of the tissue stiffness.11
SEL has recently been used in the musculoskeletal area, where the achilles tendon has been the primary focus.12 A few studies have found significant associations between pathology identified by SEL and MRI in patients with supraspinatus tendinopathy,13 14 besides significant correlations between results from SEL and clinical tests and questionnaires in patients with small supraspinatus tendon tears.15 One study also found SEL to be able to detect increased stiffness in the supraspinatus tendon elasticity and muscle elasticity with increased muscle contraction in healthy participants.16 Although only a few studies have been performed, and with different aims, comparator instruments, procedures, reference tissues and data types, the concurrent validity of SEL in the supraspinatus tendon seems promising.13–16
However, the reliability of SEL must first be proven to be acceptable. In this respect, SEL constitutes several challenges since SEL is a technique with relatively high operator-dependency in terms of the manually applied pressure and subsequent identification and selection of the pathological ROI.
One of only two reliability studies found the inter-rater reliability of SEL in the supraspinatus tendon to be almost perfect (κ=0.83) with respect to the number of focal lesions in 118 patients with MRI-verified supraspinatus tendinopathy.14 However, this study did not include a healthy control group which is recommended for reliability and validity studies, to achieve realistic tissue variation.17 Furthermore, the study used only colour quantification.14 The other study found a high intra-rater reliability (intraclass correlation coefficient (ICC) 1,3 = 0.92 to 0.99) with respect to ROI, when using an acoustic coupler as the reference tissue in a small sample of 23 healthy participants. The limitations of this study were: not including a group with pathology, not defining ROI and only using one type of reference tissue (acoustic coupler).16 Since standardised and consensus procedures for conducting elastography in the supraspinatus tendon have not yet been established, there is a need to investigate which reference tissue has the highest reliability. To our knowledge, there has not been a study investigating the reliability of SEL in the supraspinatus tendon that has included both patients with a pathological (non-ruptured) supraspinatus tendon and healthy participants with non-painful shoulders. Furthermore, choice of reference tissue and quantification methods has major impact on results, but no reliability studies have compared these different approaches.
The aim of this study was to test the intra-rater and inter-rater reliability of SEL within the supraspinatus tendon in patients and healthy participants, using different reference tissues (deltoid muscle (DELT) and gel pad (GEL)) and different quantification methods (raw data, strain ratios, colour scale rating and counting number of yellow/red lesions).
Materials and methods
This study was an intra-rater and inter-rater reliability study of SEL, used on the supraspinatus tendon, reported according to the Guidelines for Reporting Reliability and Agreement Studies.18
A three-phased intra-rater and inter-rater reliability protocol for diagnostical reliability studies was used.17 The protocol included a training phase (Phase One), an overall agreement phase (Phase Two) and an actual study phase (Phase Three), for securing low clinician dependency and subjectivity, sufficient experience and standardisation and minimisation of systematic bias.17 In order to progress to the study phase, the criterion of at least 80% inter-rater agreement in Phase Two was used. Such a protocol has previously been used in reliability studies, using ultrasound methods.19 20
Study procedures
The study’s participants were recruited from August 2016 to December 2017. Symptomatic participants, with an MRI-verified supraspinatus tendinosis (patients), were recruited from the Radiology Department at Odense University Hospital within 14 days of their MRI examination. Participants with no shoulder symptoms (healthy participants) were recruited primarily from the University of Southern Denmark and the UCL University College, both situated in Odense. Except for MRI, all the procedures were performed at the University of Southern Denmark. After inclusion, participants underwent clinical tests (performed by KGI) and filled out questionnaires regarding functional limitations, pain and quality of life. Testing procedures took place once and lasted approximately 1 hour.
All SEL images were captured by the same clinician (KB), while two raters performed the SEL measurements on the captured images. Rater 1 (KB), radiographer, was thoroughly trained in using SEL on the shoulder by Rater 2 (JH), radiologist, who had more than 20 years experience in clinical musculoskeletal ultrasound. In Phase Three, the raters were blinded to each other’s results (data were stored separately), the participants’ health status (Rater 1 entered the room after clinical tests and questionnaires were performed, and Rater 2 had no contact with the participants) and their MRI results (ID numbers were changed after MRI examinations).
SEL images were stored for at least 14 days after image capturing until the first image assessment, to ensure elimination of any memory of pain response during SEL by Rater 1. Further, all SEL images were stored for an additional 14 days before Rater 1’s second assessment, to ensure elimination of recalls of SEL results from the first assessment.
All participants had oral and written information about the study and signed an informed consent form before participation in this study.
Patient and public involvement
Patients and the public were not involved in the design or planning of the study.
Participants
Inclusion and exclusion criteria
An inclusion criterion for both patients and healthy participants was age 18 to 65 years. In addition, patients had to have at least one shoulder clinically diagnosed with tendinosis (positive signs from ≥3 clinical tests (Hawkins-Kennedy test, Neers test, Empty Can test, Full Can test, Resisted external rotation test)) and based on MRI (≥grade 1; corresponding to focal increase in tendon signal on proton density-weighted and fat-suppressed T2 sequences not equal to that of fluid.21
If both shoulders were MRI-scanned, the most severely affected side was included.
Inclusion criteria for the healthy participants were no previously experienced shoulder problems and negative signs from all five clinical tests described above. For these participants, the choice of shoulder was matched with that of the patients.
Exclusion criteria for both groups were: Tears >1/3 of the vertical height of the supraspinatus tendon, since the stress may be increased on the intact tendon part, and calcifications >2 mm (length) due to acoustic shadowing. Further exclusion criteria were: previous comorbidities (potentially harmful to the tendon) such as; past/present shoulder fractures, surgery and luxation, known neuromuscular disease, rheumatoid arthritis, cancer, fibromyalgia, spondyloarthropathy and psychiatric disorders. Pregnancy and inability to read and understand Danish were also exclusion criteria.
SEL image capturing and measurement
Apparatus
All measurements were performed with the Logiq S7 using a 15 MHz linear probe (GE Healthcare, Milwaukee, USA). Manufacturer recommendations for musculoskeletal SEL of the shoulder were used, including a transducer movement rate of approximately 120 cycles/min, axial smoothing of 2, lateral smoothing of 3, frequency of 10 and a soft/hard compression of 5.
Patient placement
The SEL was obtained with the patient sitting in an erect posture with the arm internally rotated, elbow flexed to 90° and with the dorsal side of the hand placed over the sacrum, as previously used.15 The probe was placed on the anterior aspect of the acromion in the coronal plane and the images were obtained just laterally to the anterior-lateral corner of the acromion in the longitudinal plane of the supraspinatus tendon (figure 1).

With the arm located behind the back and the elbow flexed at 90° and the palm facing posteriorly, the probe was placed just laterally from the anterior-lateral corner of the acromion in the longitudinal plane of the supraspinatus tendon.
Image capturing
An image window depth of at least three times the tendon size and an image width covering about three-quarters of the screen were used as recommended for longitudinal SEL.22 The tissue was compressed approximately 2 to 5 mm,9 and a software incorporated quality control (expressed as one to five green bars being displayed, with five bars being the most acceptable) was used to evaluate the recommended compression size.
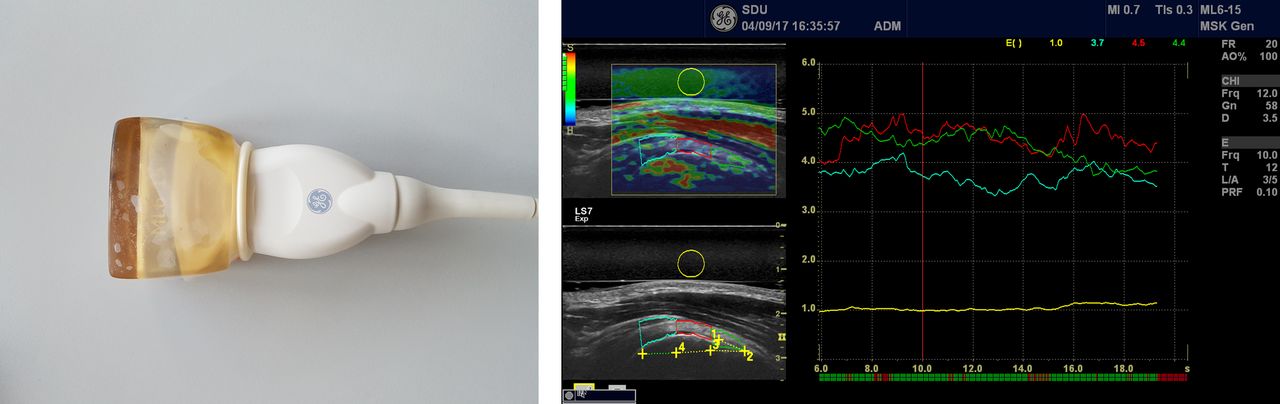
For each assessment method (with or without GEL covering the transducer, (Sonokit (Proxon), thickness: 10 mm, length: 70 mm, elastic modulus: 226 kPa; Sonogel Vertriebs GmbH, Germany)), three sessions of 20 s were obtained.
Image measurements
Tendon characteristics were evaluated quantitatively and qualitatively.
Quantitatively, ROIs on the SEL images were drawn over the target area (supraspinatus tendon) and the exact raw strain value (RAW) (0 to 6; 6 being the hardest tissue) was calculated.
Further, an adjacent reference region (normal tissue, experiencing the same stress as the target region) was drawn. From these two variables, the strain ratio (0 to 60; 60 being the hardest tissue) was calculated.23 Two different reference tissues were used: a 1 mm circle region in a soft part of the deltoid/bursal area for the DELT measurement (figure 2), and a 5 mm circle region in GEL covering the transducer, for the GEL measurement (figure 3).13 24 GEL was used as a more homogeneous reference tissue.

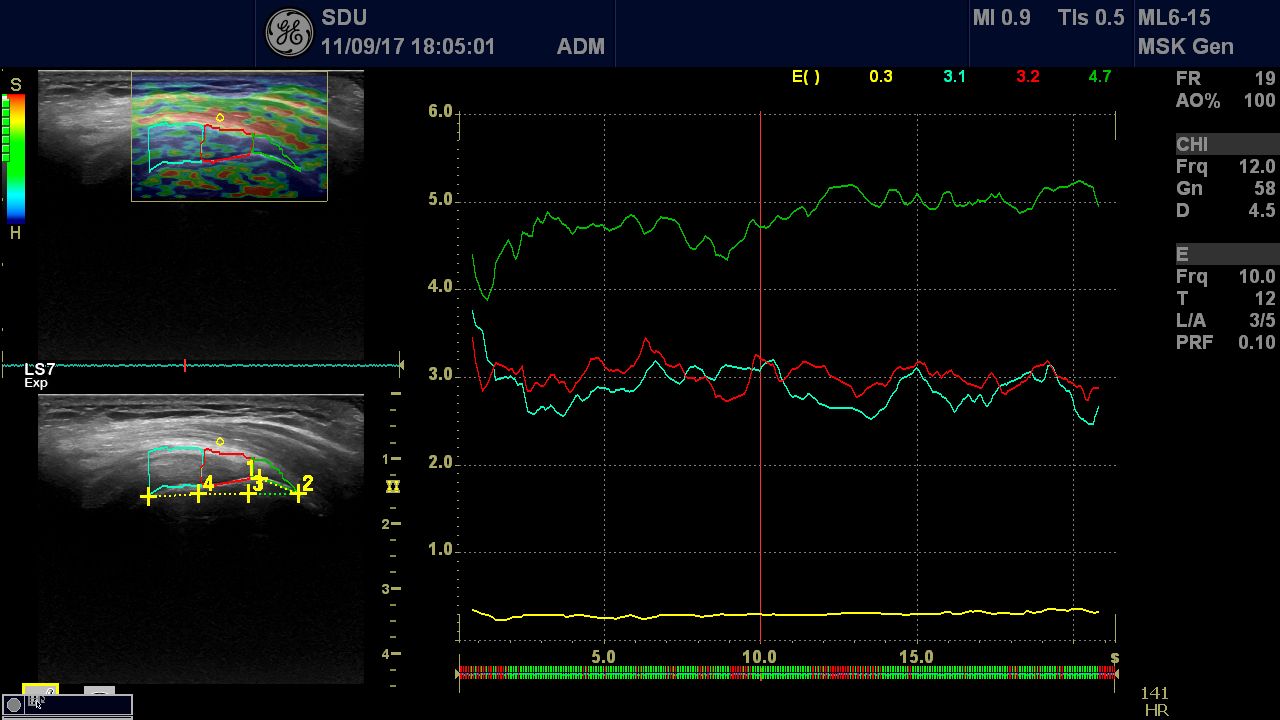
Left side: For measuring elastography characteristics of the supraspinatus tendon, the tendon was split into three parts (3×7.7 mm), illustrated by the areas of blue, red and green colours. This division was based on a line from the lateral tendon insertion (greater tubercle) to the medial tendon insertion, corresponding to 6.5 mm, and from there a line of 23 mm to the medial tendon with the end point (medial part) being perpendicular to the superior surface of the tendon. The yellow circle in the soft part of the deltoid muscle is used as the reference tissue. Right side: The three measurement areas (ROIs) and one reference area with elastography characteristics (raw data) during the time of measurement. ROI, the regions of interest.

Left side: Gel pad (mounted on the transducer with a condom used as the other reference area, yellow circle). Right side: The corresponding elastography image/measurements.
For the raw values alone and the strain ratios (strain raw value of supraspinatus tendon (A) to strain raw value of reference tissue (B) = A/B), a mean of the three measured areas of the supraspinatus tendon was calculated including data from 5 to 15 s of the 20 s cycle as recommended by the manufacturer.
Quantitative measurements were based on examination of three entire cine-loops (10 s) rather than on single static images,25 in order to minimise intra-observer variation and avoid transient temporal fluctuations. Only sequences with the highest image quality (with green bars on the quality assessment) were used as recommended by the manufacturer.
Due to difficulties in defining the most lateral part of the supraspinatus insertion on the humeral head, a 6.5 mm chord was drawn (in the lateral direction) from the medial part of the insertion on the humeral head to the lateral part of the tuberculum major. The average length of the supraspinatus insertion has previously been estimated to be 6.5 mm.26 This fix point (end of the line at the lateral part of the insertion) was used to draw a 23 mm (7.7×3) horizontal line in the medial direction (which has been estimated to be the average length of the tendon),27 ensuring agreement of measurement area (figure 4).

A 6.5 mm chord was drawn (in a lateral direction) from the medial part of the insertion on the humeral head to the lateral part of the tuberculum major. This fixed point (end of the line at the lateral part of the insertion) was used to draw a 23 mm (7.7×3) horizontal line in a medial direction ensuring agreement of measuring area.
Caudal borders for image measurements were bony surfaces (of the humeral head), while cranial borders were the transition zone between the superior surface of the supraspinatus tendon and the inferior surface of the deltoid muscle and bursa. The bursa area was used as reference tissue (red colour in the SEL image). If no red border was seen, an estimated border followed the superior surface of the tendon.
Qualitatively, the images were rated using a colour scale, from 1 to 4, according to the following: Type 1, <10% colour other than blue (indicating a high tissue stiffness); Type 2, 11% to 25% colour other than blue; Type 3, 26% to 50% colour other than blue or Type 4, >50% colour other than blue (indicating a low tissue stiffness). Furthermore, the number of yellow/red lesions was graded as follows: 0 = no lesions, 1 = one lesion, 2 = two lesions and 3 = more than two lesions.14 The qualitative classifications were all performed on the first high-quality image recorded closest to 10 s into the first cycle.
Development of SEL method
Based on previous studies,14 16 25 28–31 a protocol with standardised procedures was developed for obtaining SEL characteristics in the supraspinatus tendon and tested in Phase One on 10 participants.
Based on the results from these participants, adjustments to the type of reference tissue and colour scale criteria were performed. One adjustment involved the replacement of the subcutaneous fat with DELT as reference tissue, since the subcutaneous fat layer in some participants was too thin to measure. Another adjustment was to base the colour scale on the percentage of colour (replacement of estimation of the most pronounced colour), which made it possible to rate a blue (hard) tendon as softer if it appeared with yellow/red lesions.
In Phase Two, the adjusted protocol was applied to 20 new participants. Overall agreement in Phase Two corresponded to >80% with blinded raters. Thereafter, Phase Three (n=40) was initiated based on the final protocol, as described above.
Questionnaires
Participants completed questionnaires, including the disabilities of the arm, shoulder and hand for investigating disability of the upper extremities (0 to 100, 100 being most disabled),32
The visual analogue scale (VAS) for assessing pain level (0 to 100, 100 being the most painful),33 the EQ-5D-3L for measuring health-related quality of life, and the EQ-VAS34 also for health-related quality of life (0 to 100, 100 being best imaginable health status). Demographical data included information on age, sex and body mass index (BMI).
Statistics
SEL data were found to be normally distributed on a histogram. For continuous data (mean of the three measured areas of the supraspinatus tendon) the ICC (model 2.3, absolute agreement, two-way random, single measures) was calculated to determine intra-rater and inter-rater reliability.35 The ICC, with 95% CI was calculated for RAW, and for strain ratios (DELT and GEL). The ICCs were interpreted as <0.40 = poor, 0.40 to 0.59 = fair, 0.60 to 0.74 = good and ≥0.75 = excellent reliability.36
Paired student t-tests were completed for statistical comparison of ratings (Rater 1 (first time) vs Rater 1 (second time) and Rater 1 vs Rater 2) using a significance level of 0.05. Bland-Altman plots with 95% limits of agreement (LOA) were calculated to evaluate systematic differences,37 with the 95% LOA calculated as the mean difference ±1.96 x SD of the difference.38
SEM was calculated using the formula: SEM = SD mean difference/√2,39 and minimal detectable change 95% (MDCindividual) was calculated using the formula: MDC = SEM x √2×1.9640 and the relative MDC was calculated as a percentage of the average SEL values of Rater 1 and Rater 2.
For ordinal data, linear weighted Cohen’s κ (LWk) was used to calculate reliability with 95% CIs for colour ratings and number of lesions. LWk was interpreted as <0 = poor agreement, 0.01 to 0.20 = slight agreement, 0.21 to 0.40 = fair agreement, 0.41 to 0.60 = moderate agreement, 0.61 to 0.80 = substantial agreement and >0.81 = almost perfect agreement.41
Statistical analyses were performed in SPSS V.25.0.
Results
Demographics varied between patients and healthy participants, on most parameters. Due to the sampling method, the patients were expected to be older, with a higher BMI, more pain and disability and reduced quality of life compared with healthy participants (table 1).
Demographics (mean; SD (frequencies and percentages for dominant arm and EQ-5D)) of patients and healthy participants from the study phase (n=40)
The paired t-test showed statistical differences in inter-rater measurements for RAW and in intra-rater measurements for GEL (table 2).
Reliability of strain elastography in the supraspinatus tendon using respectively the deltoid muscle (reference) and a gel pad (reference) and raw data from the study phase (n = 40)
None of the Bland-Altman plots showed funnel effects (increasing difference with increasing mean size) (figure 5).

Bland-Altman plots with 95% limits of agreement for measurements, using respectively raw data, the deltoid muscle and a gel pad as reference areas. Values are based on the mean of the three measured parts across the supraspinatus tendon.
For intra-rater and inter-rater reliability, there was ‘excellent agreement’ using RAW and DELT (ICC: intra-rater: 0.97, inter-rater: 0.89), (ICC: intra-rater: 0.89, inter-rater: 0.78) respectively and the reliability was ‘good’ when using GEL (ICC: intra-rater: 0.73, inter-rater: 0.70) (table 2). The same pattern of results was also seen for each of the three measured areas of the supraspinatus tendon (medial, middle and lateral parts) (not shown in tables).
For the intra-rater reliability, the relative MDC was smallest for RAW (6.36%), larger for DELT (20.37%) and largest for GEL (58.82%). For inter-rater reliability, the same pattern was seen for MDC, with a minimum of 10.53%, 25.51% and 62.63%, for RAW, DELT and GEL, respectively.
The reliability of using the colour scale (performed without GEL), kappa (LWk) was very similar, with intra-rater reliability ranging from LWk: 0.76 to 0.79, representing ‘substantial agreement’, and inter-rater agreement ranging from LWk: 0.71 to 0.81 representing ‘substantial-to-almost perfect agreement’.
For the number of yellow/red lesions, LWk was generally highest for intra-rater ranging from 0.40 to 0.82 representing ‘fair-to-almost perfect agreement’, while for inter-rater reliability LWk ranged from 0.24 to 0.67 representing ‘fair-to-substantial agreement’ (table 3).
Reliability of strain elastography in the supraspinatus tendon using data based on colours, respectively a colour scale and counting the number of lesions from the study phase (n=40)
For the medial and middle tendon part of the supraspinatus, LWk was ‘substantial-to-almost perfect’ for intra-rater (LWk 0.75 to 0.82) and ‘substantial’ for inter-rater (LWk 0.63 to 0.67) reliability, while for the lateral tendon part, LWk was low, corresponding to only 0.40 and 0.24 for intra-rater and inter-rater reliability, respectively, representing ‘fair agreement’.
Discussion
The reliability of the results from SEL was ‘excellent’ when using the raw data and DELT as reference tissue. When using GEL as reference tissue, the reliability of the results was ‘good’. Furthermore, the relative MDC (% of mean) was smallest for RAW and largest for GEL.
When using the colour scale grading, LWk represented ‘substantial agreement’ to ‘substantial-to-almost perfect agreement’. For the number of yellow/red lesions, LWk was highest for intra-rater reliability, in the medial and middle tendon parts, LWk was ‘substantial-to-almost perfect’, while for the lateral tendon part LWk was low, corresponding to only ‘fair’ agreement’.
Strain ratios and raw data
The ROIs with raw SEL data (no reference tissue) resulted in the highest reliability in intra-rater as well as inter-rater reliability. Although there was a significant difference between Rater 1 and Rater 2 for RAW, this difference was less than the MDC and is ascribed to measurement error.
To our knowledge, no study has previously presented raw SEL data, which precludes comparison with other studies. Using raw data has limitations, since there is, in comparison with using ratios, no possibilities to adjust for different transducer pressures. On the other hand, the advantage is that it gives a more quantitative estimate than when using visual inspections, as for example in the colour scale, or with uncertainties due to selection of reference tissue.
In the current study, only one rater captured the images (using almost the same pressure) and two raters traced and measured the areas. If more than one rater were to capture the images, a lower reliability may be expected, due to potentially different transducer pressure.
Different reference tissues in SEL measurements of the musculoskeletal area make it difficult to compare data across studies. The reference tissues previously used for calculating strain ratios in the achilles and supraspinatus tendon areas have included bone,15 fat13 25 31 42 43 and GEL/acoustic coupler.13 16 44 Using bone as a reference value has limitations, since ultrasound cannot penetrate bone material, meaning that data coming from this region are artefacts.
In addition, strain ratios may be based on different equations in different studies, placing the ROIs of the tendon in the denominator,13 45 or, as in the current study, in the numerator.25 31
Due to thin subcutaneous fat tissue area in some participants, the reference tissue was replaced, after Phase One, with DELT and GEL (artificial fat tissue).
When using DELT as the reference tissue, reliability was found to be excellent (both intra-rater and inter-rater). Muscle tissue increases stiffness significantly after exercise and muscle contractions,16 24 and therefore, limitations are recognised when using this tissue as reference when for example, investigating tendon tissue response to muscle contractions.
However, no previous study of SEL on the supraspinatus tendon has used muscle tissue as a reference for the calculated strain ratios.
The current study found a high MDC for GEL (large measurement error) but a good reliability (ICC 0.70 to 0.73), in line with previous studies. One study, using the Kager’s fat pad (fat deposit within the Kager triangle anterior to the achilles tendon) as reference tissue in the achilles tendon, also found good-to-excellent intra-rater and inter-tester reliability (ICC: 0.51 to 0.78) in the longitudinal plane; however, with much lower reliability (ICC: 0.41 to 0.45) in the axial plane.25 Unfortunately, MDC was not reported. The ICC and MDC in the current study are reported as single measures, as it is of relevance to clinicians. None of the previous studies16 44 have described whether ICC is reported as a single measure or (group) average measure, however, it is anticipated that it is a group average measure. In the current study, the ICC will increase about 10% and the MDC will decrease up to 80% when reported as average measures. This could explain some of the differences in results between the current and previous studies.
In the current study, the data using GEL are also in line with a study using an acoustic coupler as reference tissue in the supraspinatus tendon,16 where excellent intra-rater reliability was shown, as was also confirmed for the achilles tendon.44 An acoustic coupler is similar to GEL and may be acceptable, but ideally, the reference area should be the same depth as the ROI (in this case, the supraspinatus tendon). As GEL is not located close to the tendon, the ROIs using GEL will not be subjected to the same amount of tissue pressure as the tendon, which may affect reliability and validity.
The current study found the lowest reliability (however, it was still graded ‘good’) when using GEL which may be caused by difficulties locating the footprint of the tendon, due to lower image quality, because of increased depth (through 10 mm of GEL).
A statistically significant intra-rater difference was also seen, but as this difference was below the MDC, it can be ascribed to measurement error.
Colour ratings
The current study found a high reliability (‘substantial’ to ‘almost perfect’) when grading the ROIs of SEL images according to a four-level colour scale, where blue tissue indicated hard tissue and red tissue indicated soft tissue. This is in line with a previous study on the achilles tendon using colour scales of five levels (1 = blue (hardest tissue), 2 = light blue, 3 = green, 4 = yellow, 5 = red (softest tissue)), where good-to-excellent inter-rater (κ=0.897) and intra-rater (κ=1) reliability was found.30
Alternative types of colour scales have been used in the musculoskeletal area, primarily for the achilles tendon, with categorisation of the achilles tendon into a two-level category scale (green/blue vs red),25 and a three-level category scale (blue/yellow/red).22 29 The current study has used the same colours for defining hard tissue (blue) and for soft tissue (red), but with a four-level category scale, and with more precise criteria for the different levels which were found necessary due to the mixture of colours in the supraspinatus tendon observed in Phase One.
In the current study, LWk in the medial and the middle parts of the tendon was ‘substantial-to-almost perfect’ when counting the number of yellow/red lesions in both intra-rater and inter-rater reliability. Even though the total agreement was also high in the lateral third of the tendon, LWk was relatively low compared with the medial and the middle parts of the tendon. The reason may be due to the low presence of lesions in the lateral part, corresponding to only 10% of the participants presenting with lesions in the lateral 1/3 of the tendon, which can lead to the ‘Kappa Paradox’.46 The Kappa Paradox means (in a 2×2 table) that an imbalance between presence and absence in overall agreement, and between disagreement (bias) can drastically lower the kappa, why prevalence and bias-adjusted kappa (PABAK) in dichotomous scales is recommended.47 A PABAK on the current number of lesions dichotomised into no lesion/lesion(s) will increase the kappa by up to 70%. Another explanation is that since the pressure is placed vertically on the medial part of the tendon, the lateral part will have experienced a smaller degree of stress.
The high reliability of the number of focal lesions (LWk intra-rater reliability: 87.5 to 90, LWk inter-rater reliability: 82.5 to 90) is in line with a previous study on the supraspinatus tendon where an almost prefect reliability (k=0.83) was found.14
The current methods of using colour grading and lesion counts for assessing tendon stiffness in the supraspinatus tendon showed high reliability. These methods are feasible for use in clinical practice as they can be performed quickly, but when more than one clinician is performing the SEL, the method cannot adjust for potentially different tranducer pressures.
Limitations
Manual compression may affect reliability, especially when using raw data, colour grading and counting yellow/red lesions. To partly counteract this, a quality bar was used that provided instant feedback on the uniformity of the transducer pressure. Reference tissues (DELT and GEL) with calculation of strain ratios were also used, thereby making a comparison possible between the methods.
Furthermore, as mentioned, SEL is highly operator-dependent, why the same (and only one) trained operator captured the present images, thereby further decreasing the risk of bias, but this limits the external validity of the results.
In addition, age was not blinded and, as reported earlier, tendons get softer with age.48 Therefore, the current blinding of examiner results and health status may not have been sufficient.
Strengths
The strength of this study was the design, incorporating a stepwise and standardised procedure for reliability which minimised bias and increased reliability.17 Furthermore, both patients and healthy participants were enrolled.
To enhance standardisation, all SEL ROIs were measured at a fixed point, just laterally from the anterior-lateral corner of the acromion in the longitudinal plane of the supraspinatus tendon.20 In addition, the reliability was estimated by using three different quantitative methods (RAW, DELT and GEL), as well as two different qualitative methods (colour and number of yellow/red focal lesions).
Conclusion
Intra-rater and inter-rater reliability were excellent using raw values and ratios with the deltoid muscle as reference tissue, and good when using a gel pad as reference tissue.
The reliability of colour scale ratings was substantial-to-almost perfect and the number of lesions was fair-to-almost perfect.
Although high reliability was found, validity and responsiveness of these elastographic methods needs further investigation.
References
Footnotes
Contributors KB, JH, PK, KGI and BJ-K conceived and designed the study protocol. KB and BJ-K procured the project funding. KB, JH, PK and BJ-K developed and standardised the ultrasound procedure. JH, KB and KGI recruited participants. KB was the project coordinator and captured the strain elastography images. KGI performed the physical tests. KB and JH rated the images. KB and BJ-K planned and coordinated the statistical analyses. KB performed the statistical analyses. KB drafted the manuscript, and JH, PK, KGI and BJ-K contributed to the manuscript. All authors read and approved the final manuscript. KB is the guarantor.
Funding This work was supported by the Region of South Denmark (14/38969, 15/24799), The Danish Rheumatism Association (R150-A4296) and the Danish Council of Radiographers (no grant number).
Competing interests None declared.
Ethics approval Ethical Committee for Region South Denmark.
Provenance and peer review Not commissioned; externally peer reviewed.
Data sharing statement No additional data are available.
Patient consent for publication Not required.