Article Text

Abstract
Objectives Determine both the effects and hierarchy of effectiveness for exercise interventions (aerobic, strength training or both) on selected measures of adiposity (body mass index (BMI) in kg/m2, fat mass and per cent body fat) in overweight and obese children and adolescents.
Design Network meta-analysis of randomised exercise intervention trials.
Setting Any setting where a randomised trial could be conducted.
Participants Overweight and obese male and/or female children and adolescents 2–18 years of age.
Interventions Randomised exercise intervention trials>4 weeks, published between 1 January 1973 and 22 August 2018, and which included direct and/or indirect evidence for aerobic, strength training or combined aerobic and strength training.
Primary outcomes Changes in BMI in kg/m2, fat mass and per cent body fat.
Results Fifty-seven studies representing 127 groups (73 exercise, 54 control) and 2792 participants (1667 exercise, 1125 control) met the criteria for inclusion. Length of training ( ± SD) averaged 14.1±6.2 weeks, frequency, 3.3±1.1 days per week and duration 42.0±21.0 min per session. Significant and clinically important reductions in BMI, fat mass and per cent body fat were observed in aerobic versus control comparisons (BMI, mean, 95% CI -1.0, 1.4 to −0.6; fat mass -2.1, –3.3 to −1.0 kg; per cent fat -1.5, –2.2 to −0.9%) and combined aerobic and strength versus control comparisons (BMI -0.7, –1.4 to −0.1; fat mass -2.5, –4.1 to −1.0 kg; per cent fat, -2.2, –3.2 to −1.2%). A significant reduction in per cent fat was also found for strength vs control comparisons (-1.3,–2.5 to −0.1%). Combined aerobic and strength training was ranked first for improving both fat mass (kg) and per cent body fat while aerobic exercise was ranked first for improving BMI.
Conclusions Aerobic and combined aerobic and strength training are associated with improvements in adiposity outcomes in overweight and obese children and adolescents.
PROSPERO registration number CRD42017073103.
- exercise
- overweight
- obesity
- children
- adolescents
- network meta-analysis
This is an open access article distributed in accordance with the Creative Commons Attribution Non Commercial (CC BY-NC 4.0) license, which permits others to distribute, remix, adapt, build upon this work non-commercially, and license their derivative works on different terms, provided the original work is properly cited, appropriate credit is given, any changes made indicated, and the use is non-commercial. See: http://creativecommons.org/licenses/by-nc/4.0/.
Statistics from Altmetric.com
Strengths and limitations of this study
To the best of the authors’ knowledge, this is the first network meta-analysis to examine the effects of exercise on adiposity outcomes in overweight and obese children and adolescents.
This study included methods to determine the clinical relevance of the reported outcomes.
Since this was an aggregate data meta-analysis, the potential for ecological fallacy exists.
Meta-regression results should be considered exploratory and thus do not support causal inferences.
Background
Overweight and obesity among children and adolescents are a major public health problem worldwide. Between 1980 and 2013, the worldwide prevalence of overweight and obesity in children and adolescents increased by 6.9%, from 16.9% to 23.8%, in boys and by 6.4%, from 16.2% to 22.6%, in girls from developed countries.1 For developing countries, increases of 4.8%, from 8.1% to 12.9% for boys and 5%, from 8.4% to 13.4% in girls, were reported.1 In terms of absolute values, 41 million children under the age of 5 and more than 340 million children and adolescents aged 5–19 were considered to be overweight or obese in 2016.2
The deleterious consequences associated with obesity in children and adolescents are both immediate and long term.3 For example, a study of children and adolescents 5–17 years of age found that approximately 70% of obese youth had at least one cardiovascular disease risk factor (high cholesterol, high blood pressure, etc.).4 Obese children and adolescents are also at an increased risk for prediabetes,5 as well as more prone to bone and joint problems, sleep apnea and social and psychological issues that include stigmatisation, low self-esteem and low health-related quality of life.6 7 Long-term, childhood and adolescent overweight and obesity has been shown to track into adulthood,8–12 thus placing overweight and/or obese adults at a greater risk for cardiovascular disease, type 2 diabetes, stroke, several types of cancer and osteoarthritis.3
One approach to treating overweight and obesity is exercise. However, previous randomised trials limited to overweight and obese male and female children and adolescents have reached conflicting results with respect to exercise-induced changes in adiposity.13–69 For body mass index (BMI in kg/m2), fat mass and per cent body fat, statistically significant decreases were reported for 45.2%, 50.0% and 40.0% of findings, respectively, as a result of exercise (aerobic, strength training or both).13–69 When limited to studies that included aerobic exercise as an intervention,13 15–17 19 21 22 24 25 29 30 32–34 36 38–46 48 50–53 55 57–64 66 67 69 statistically significant decreases in BMI in kg/m2, fat mass, and per cent body fat were reported for 43.2%, 66.7% and 75.0% of findings. For strength training interventions,14 21 28 35 39 40 47 53 54 56 57 statistically significant decreases were reported for 9.1% (BMI in kg/m2), 25.0% (fat mass) and 63.6% (per cent fat) of findings. Finally, when restricted to combined aerobic and strength training,13 18–21 23 26 27 31 37 45 49 51 57 64 67 69 statistically significant decreases were reported for 78.6% (BMI in kg/m2), 44.4% (fat mass) and 69.2% (per cent fat) of results. While this may lead one to question the benefits of exercise for improving adiposity in overweight and obese children and adolescents, this would be shortsighted since it relies on the vote-counting approach,70 an approach that has been shown to be less valid than the meta-analytic approach.70 To address these discrepancies in findings, several previous systematic reviews with aggregate data meta-analyses limited to randomised trials focused on the effects of exercise (aerobic, strength or both) as an independent intervention on one or more measures of adiposity as primary outcomes (BMI in kg/m2, fat mass, per cent fat) in overweight and obese children and adolescents have been conducted.71–75 Across all intervention types, two73 75 of four71 73–75 reported statistically significant reductions in BMI in kg/m2, one of one reported a statistically significant reduction in fat mass,74 and one71 of two71 75 a statistically significant reduction in per cent fat. Another meta-analysis focused on combined aerobic and resistance training reported statistically significant reductions in BMI in kg/m2, fat mass and per cent fat.72 A lack of meta-analytic data was available on the effects of aerobic and resistance training alone on BMI in kg/m2 as well as fat mass and per cent fat.71–75 In addition, randomised trials without a control group, i.e., direct evidence studies that assessed the effects of exercise on adiposity outcomes, were absent.71–75 Furthermore, there was an absence of an established hierarchy for determining which types of exercise (aerobic, strength training or both) might be best for improving adiposity outcomes based on both direct and indirect evidence.71–75 Network meta-analysis is an approach that includes both direct and indirect evidence as well as allowing for the ranking of treatments. To demonstrate the feasibility of this approach, the authors recently used the network meta-analytic approach to examine the effects of exercise (aerobic, strength training or both) on BMI z-score in overweight and obese children and adolescents.76 77 Statistically significant reductions in BMI z-score were found for aerobic exercise and combined aerobic and strength exercise, but not strength training alone (mean, 95% CI: aerobic, -0.10, –0.15 to −0.05; aerobic and strength, –0.11, –0.19 to −0.03; strength, 0.04, –0.07 to 0.15).77 Combined aerobic and strength training was ranked the best, followed by aerobic exercise and then strength training.77 It was concluded that combined aerobic exercise and strength training as well as aerobic exercise alone are associated with reductions in BMI z-score.77 While these results are encouraging, BMI in kg/m2 continues to be the most frequently assessed and reported measure of adiposity across all ages in both the clinical and public health setting. Thus, an examination of such using the network meta-analytic approach is needed. In addition, since all types of BMI measures as well as body weight do not capture changes in body composition (fat mass, per cent body fat, etc.), the inclusion of such outcomes, as previously suggested,77 is also necessary. Thus, given (1) the prevalence of overweight and obesity in children and adolescents, (2) the negative consequences associated with such, (3) the conflicting findings of previous randomised trials addressing the effects of exercise on adiposity outcomes in overweight and obese children and adolescents and (4) the strengths of network meta-analysis, the two primary objectives of the current study were to conduct a systematic review with network meta-analysis of randomised trials to (1) determine the effects of exercise (aerobic, strength training or both) on adiposity (BMI in kg/m2, fat mass, per cent body fat) in overweight and obese children and adolescents, and (2) establish a hierarchy of exercise interventions (aerobic, strength training or both) for treating adiposity (BMI in kg/m2, fat mass, per cent body fat) in overweight and obese children and adolescents.
Methods
Overview
This study followed the guidelines from the Preferred Reporting Items for Systematic Reviews and Meta-Analyses (PRISMA) extension statement for network meta-analyses of healthcare interventions.78 The protocol for this network meta-analysis has been published in BMJ Open.79 We provide a brief description of the methods used and include a description of any deviations from the original protocol,79 including reasons. Detailed information regarding the methods can be found in the originally published protocol.79
Patient and public involvement
No patient involved.
Eligibility criteria
The inclusion criteria for this proposed network meta-analysis were as follows: (1) direct evidence from randomised trials that compared two or more exercise interventions (aerobic, strength training, both) or indirect evidence from randomised controlled trials that compared an exercise intervention group to a comparative control group (non-intervention, attention control, usual care, wait list control, placebo, etc.), (2) exercise-only intervention (aerobic, strength training or both), (3) studies lasting ≥4 weeks, (4) male and/or female children and adolescents 2−18 years of age, (5) participants overweight or obese, as defined by the authors, (6) studies published in any language up through 22 August 2018 and (7) data available for BMI in kg/m2, fat mass or per cent body fat. The 22 August 2018 end date for searching was extended from the originally proposed end data of 30 August 2017 listed in the original protocol in order to stay as current as possible and while allowing for the time it takes to complete all stages of a network meta-analysis.79
Information sources
The following seven electronic databases were searched: (1) PubMed, (2) Web of Science, (3) Cochrane Central Register of Controlled Trials, (4) Cumulative Index to Nursing and Allied Health Literature, (5) SPORTDiscus, (6) Translating Research into Practice and (7) ProQuest Dissertations and Theses. In addition to electronic database searches, cross referencing was conducted by examining the reference lists of previous review articles as well as each included study for potential articles that met the inclusion criteria. On completion of initial searches, the third author examined the reference list for thoroughness and completeness.
Search strategy
Search strategies specific to each database were developed by the investigative team. The searches covered the periods from 1 January 1973 to 22 August 2018. A copy of one of the databases searched (PubMed) is shown in online supplementary file 1. All database searches and article retrieval were conducted by the second author with oversight from the first author.
Supplemental material
Study records
Study selection
To minimise selection bias, the first and second authors selected all studies independent of each other. They then reviewed their selections for agreement. Reasons for excluded studies were recorded using the following categories: (1) inappropriate population, (2) inappropriate intervention, (3) inappropriate comparison(s), (4) inappropriate outcome(s), (5) inappropriate study design and (6) other. On completion of screening, the first and second authors met and reviewed all selections. Cohen’s kappa statistic (κ) was used to measure interselection agreement.80 Any discrepancies were resolved by discussion. If agreement could not be reached, the third author served as an arbitrator. On selecting the final number of studies to include, the overall precision of the searches was computed by dividing the number of included studies by the total number of studies screened after removing duplicates.81 The number needed to read (NNR) was then calculated as the reciprocal of the precision.81
Data abstraction
For this project, Microsoft Excel (V.2016; Microsoft Corporation; 2016) was used to develop comprehensive electronic codebooks that could hold up to 1475 items from each study. The major categories of variables coded included (1) study characteristics (author, journal, year of publication, etc.), (2) participant characteristics (age, gender, height, body weight, etc.), (3) intervention characteristics (type, length, frequency, intensity, duration, compliance, etc.) and (4) data for primary and secondary outcomes (sample sizes, baseline and postexercise means and SD, etc.). To avoid data abstraction bias, the first two authors independently coded (dual coding) all studies. The first two authors then met to review their decisions. Any disagreement in the items coded were discussed until mutual agreement was achieved. If agreement could not be reached, the third author provided a recommendation. Using Cohen’s kappa statistic (κ),80 inter-rater agreement prior to correcting discrepant items was 0.95.
Outcomes and prioritisation
The a priori primary outcomes in this study were changes in BMI in kg/m2, fat mass and per cent body fat in overweight and obese children and adolescents. Secondary a priori outcomes included body weight, lean body mass, waist circumference, waist-to-hip ratio, energy intake, energy expenditure, physical activity level, maximum oxygen consumption (VO2max in mL/kg/min), muscular strength, resting systolic and diastolic blood pressure, total cholesterol, high-density lipoprotein cholesterol, ratio of total cholesterol to high-density lipoprotein cholesterol, non-high density lipoprotein cholesterol, low-density lipoprotein cholesterol, triglycerides, glycosylated haemoglobin, fasting and non-fasting glucose and insulin. Missing data for primary outcomes were requested via electronic mail. Post hoc, waist-to-hip ratio, energy intake, energy expenditure, physical activity level, muscular strength, ratio of total cholesterol to high-density lipoprotein cholesterol, non-high density lipoprotein cholesterol, glycosylated haemoglobin and non-fasting glucose and insulin were not examined because of a lack of data across the three treatments.
Risk-of-bias assessment in individual studies
Risk of bias for included studies was assessed using the Cochrane Risk of Bias Instrument.82 Judgements of low, high or unclear risk of bias were made across seven domains. Assessment for risk of bias was limited to the primary outcomes of interest (changes in BMI in kg/m2, fat mass, and per cent body fat). All studies were classified as high risk of bias with respect to the category ‘blinding of participants and personnel’ given that it is virtually impossible to blind participants to group assignment in exercise intervention protocols. No trial was excluded based on risk-of-bias results.83 The first two authors independently assessed risk of bias (dual coding) for all studies. Any disagreements in the items coded were discussed until mutual agreement was reached. If mutual agreement could not be achieved, the third author served as an arbitrator. Using Cohen’s kappa statistic (κ),80 inter-rater agreement prior to resolving disagreements was 0.72.
Data synthesis
Calculation of effect sizes
Changes in outcomes for randomised controlled trials were calculated by subtracting the change outcome differences between the exercise and control groups. Variances were computed using the pooled SD of change scores in the exercise and control groups. If change score SD were not available, they were calculated from 95% CIs for either change outcome or treatment effect differences as well as pre-SD and post-SD values, the latter according to procedures developed by Follmann et al.84 For direct comparisons, that is, randomised trials with no control arm, the same procedures were used as for randomised controlled trials by taking the differences and variances between the two treatment groups. For studies in which adiposity outcomes were assessed at multiple intervention time points, only data from the initial and last assessment were used. A post-hoc decision was made to not analyse follow-up data because of the lack of available endpoints. Cross-over trials were handled by using all assessments from the intervention and control periods and analysing them similar to a parallel group trial.85
Pooled estimates for changes in outcomes
Network (geometry) plots were used to provide a visual representation of the evidence base with nodes (circles) weighted by the number of participants randomised to each treatment and edges (lines) weighted by the number of studies evaluating each pair of treatments.86 87
Transitivity, that is, similarity in the distribution of potential effect modifiers across the different pairwise comparisons for each outcome88 was examined using χ2 tests for categorical variables and one-way analysis of variance tests for continuous variables. If statistically significant differences were found, follow-up tests were conducted, when necessary, using the Bonferroni approach for continuous data and 2×2 χ2 tests for categorical data. A two-tailed alpha value <0.05 was considered to be statistically significant. Variables analysed between treatment contrasts included risk-of-bias variables (sequence generation, allocation concealment, blinding of outcome assessors, incomplete outcome data, selective reporting, physical activity), type of control group, age, gender, training programme characteristics (length, frequency, intensity, duration, compliance, exercise supervision status), baseline values for the outcome of interest and method for assessing the outcome of interest.
Network meta-analysis was performed using random-effects, multivariate, restricted maximum likelihood models performed within a frequentist setting and which allowed for the inclusion of potential covariates while accounting for the correlations from multiarm trials.89 90 A two-tailed alpha value <0.05 and non-overlapping 95% CI were considered to represent statistically significant changes. In addition, 95% prediction intervals were generated in order to examine the interval in which the outcome of interest in a future study would lie.91 Global inconsistency across each network was examined using the Wald test,92 with an alpha value <0.05 considered to represent statistically significant inconsistency. Small-study effects (publication bias, etc.) across all comparisons were conducted using funnel plots and Egger’s regression-intercept test.93 94 An alpha value <0.05 was considered to represent statistically significant small-study effects.
Potential covariates were examined by conducting simple meta-regression for statistically significant associations between covariates and changes in the primary outcomes (BMI in kg/m2, fat mass, per cent fat). A list of covariates examined using simple meta-regression is shown in online supplementary file 2. A post-hoc decision was made to not conduct any type of multiple meta-regression because of missing data for different variables from different studies.
Supplemental material
To establish a hierarchy of exercise interventions for all outcomes in the current meta-analysis, the surface under the cumulative ranking curve (SUCRA), a transformation of the mean rank, was used and while accounting for the location and variance of all treatment effects.86 95 Larger SUCRA values indicate better ranks for the treatment.86 95 Interpretation of all rankings was approached from the perspective of both absolute and relative treatment effects.87
Confidence in cumulative evidence
The a priori plan was to examine for the strength of evidence for network meta-analyses using the approach described by Salanti et al.96 However, since that time, an alternative approach has been suggested,97 with no clear consensus and continuing controversy on the best approach for network meta-analysis, including the validity and reliability of these assessment tools. Therefore, a post-hoc decision was made to use a qualitative approach versus a formal assessment instrument to examine for the strength of the evidence.
Software used for statistical analysis
All data were analysed using Stata (V.14.1; Stata/SE for Windows, V.14.0. Stata Corporation LP; 2015), Microsoft Excel (V.2016; Microsoft Corporation; 2016) and two add-ins for Excel, SSC-Stat (V.2.18; SSC-Stat, V.3.0. University of Reading, UK: Statistical Services Center; 2007), and EZ-Analyze (V.3.0; EZ Analyze, V.3.0. TA Poynton; 2007).
Results
Study characteristics
Of the 6478 citations screened after removing duplicates both electronically and manually, 57 studies representing 127 groups (73 exercise, 54 control) and 2792 participants (1667 exercise, 1125 control) met the criteria for inclusion.13–40 42–69 98 The number needed to screen was 0.88% while the NNR was 114. Reasons for exclusion, in order of prevalence, included inappropriate study design (48.4%), inappropriate population (20.5%), inappropriate intervention (13.6%), other, for example, editorials (9.6%), inappropriate outcome (6.9%), inappropriate comparison (1.0%) and unable to retrieve data (0.03%). A flow diagram that depicts the search process is shown in figure 1 while a list of the 6421 excluded studies, including the reasons for exclusion, can be found in online supplementary file 3. A total of four different requests for data were made to authors, two (50%) of which provided such.
Supplemental material

Flow diagram for selection of studies. Flow of information through the different phases of the systematic review and network meta-analysis. CINAHL, Cumulative Index to Nursing and Allied Health Literature; TRIP, Translating Research into Practice.
General study characteristics are shown in online supplementary file 4. The included studies were published in 45 different journals since 1997 ( ± SD = 2011±4, median=2012). Fifty-two studies (91.2%) were published in the English language,13 14 16–18 20 22 24–40 42–69 while the remaining five (8.8%) were published in either Chinese19 21 23 98 or Spanish.15 The location in which studies were conducted included 20 different countries, 12 in the USA,24 30 34 35 39 40 46 48 52 56 60 66 8 in China,19–23 38 61 62 98 6 in Brazil,13 15 45 47 58 63 5 in South Korea,36 37 49 55 59 4 in Tunisia,17 25 50 51 3 each in Australia,54 64 65 Canada14 32 57 and Iran,27 29 69 2 in Turkey,33 53 and 1 each in either France,16 Germany,44 Italy,28 Lebanon,68 New Zealand,42 Norway,18 Singapore,67 Sweden,31 Switzerland,26 Taiwan22 or the UK.43 Of the 57 included studies, 45 (78.9%) were two-arm randomised controlled trials limited to 1 exercise and 1 control group that met all eligibility criteria,14–20 22 23 25–27 29–31 33–37 42–44 46–49 52–56 58–69 98 7 (12.3%) were three-arm randomised controlled trials that included 2 exercise arms,24 32 38–40 50 51 and 2 (3.5%) were four-arm randomised controlled trials that included three exercise arms.21 57 The remaining three studies (5.3%) were randomised trials that compared two or more different exercise interventions directly but did not include an eligible control group.13 28 45 Ten of 57 studies (17.5%) included matching procedures according to either race/ethnicity,60 age, sex and BMI,34 age and sex,45 BMI,45 sex and BMI,13 race/ethnicity and sex,24 42 48 sex49 or sex and degree of overweight.57 Two studies (3.5%) used a cross-over design.64 65 With respect to the statistical analysis of data, 39 studies (68.4%) used the per protocol approach,13 14 16 17 19–23 25 27–31 33–38 44 46–48 50–53 55 56 58 59 63–65 67–69 11 (19.3%) used intention-to-treat or reported that all subjects completed the study,18 24 42 43 45 49 54 61 62 66 98 while 7 (12.3%) used both per protocol and intention-to-treat analyses.15 26 32 39 40 57 60 Only 18 studies (31.6%) reported sample size estimates for their primary outcome(s) of interest.15 18 22 24 26 32 35 39 42 45 48 49 54 57 59 63 65 66 In relation to funding, 42 studies (73.7%) reported receiving financial support for their research,13 14 17 18 20 22 24–26 30–32 34–40 42 44–52 54–57 59–61 63–68 16 from government sources,17 18 22 24 25 30 31 47 50 51 54 55 60 61 66 68 4 from private sources,45 52 64 65 8 from universities,14 20 37 38 44 49 59 67 8 from both government and private sources,32 34 39 40 42 46 48 63–68 3 from government and university sources,13 26 35 2 from government, university and private sources56 57 and 1 from university and private sources.36 None of the studies reported any information on the cost effectiveness of their interventions. Overweight and obesity was most commonly defined using age and sex-specific BMI cutpoints. However, variability existed in the criteria used to determine overweight and obesity (online supplementary file 4).
Supplemental material
Participant characteristics
Baseline characteristics of the participants are shown in online supplementary file 4 and table 1. More than half the studies (57.1%) included both males and females,13–18 20 22 24 26 28 30–32 34 38 42–46 48 49 52 57 58 61–65 68 followed by those limited to males (32.1%),19 23 25 27 29 33 35–37 39 47 54–56 59 67 69 98 and females (10.7%).40 50 51 53 60 68 Participants included those across all five stages of puberty.13 14 16 17 24–26 32 34 35 39 40 43 50 56 57 63 64 68 69 For those studies that reported race/ethnicity,16–20 23 24 30 32 35 39 40 42 48 52 56 57 59–62 65 66 98 and as reported by the authors, participants included whites, blacks/African Americans, Asians, Hispanics/Latinos, Native Hawaiian/Pacific Islander, Maori, Aboriginal, Arabic, Chinese, Koreans, French, Norwegian, Tunisian and native Canadian. Some studies included one or more participants with hyperlipidaemia,17 26 52 hypertension,26 56 metabolic syndrome17 34 46 56 and/or asthma.46 52 For those studies in which data were available, none reported that any of the participants smoked cigarettes19 27 39 40 44 64 65 67–69 98 or consumed alcohol.13 98 For the 31 studies (54.4%) that reported data by group,15 20 22 24 26 28 32 34 35 37 39 40 42 44 45 48–51 54–58 60–63 66 68 98 dropouts ranged from 0% to 60.9% in the exercise groups ( , 15.2±14.5, median=12.5) and 0% to 61.5% in the control groups (
 , 14.9±14.9, median=13.8).
Baseline physical characteristics of participants*
Reasons for dropouts in the exercise group were varied, consisting of such things as lack of time, personal reasons, dissatisfaction with programme and logistics. For the control groups, reasons included such things as unhappiness with group assignment and logistics. Of the 11 studies (19.3%) that reported data on adverse events,24 32 42 47 51 57 60 62 64–66 only one reported a serious adverse event (one foot fracture).24
Exercise intervention characteristics
Characteristics of the exercise interventions are shown in online supplementary file 4 and table 2. Forty-one studies (71.9%) included aerobic exercise,13 15–17 19 21–25 28–30 32–34 36 38–40 42–46 48 50–53 55 57–63 65 66 68 69 98 9 (15.8%) included strength training21 28 35 39 40 47 54 56 57 and 17 (29.8%) included combined aerobic and strength training.13 14 18 20 21 23 26 27 31 37 45 49 57 58 64 67 69 While methods for assessing the intensity of training for both aerobic and resistance exercise varied between the 38 studies (66.7%) that reported such information,14 17 19–22 24 26–28 30 32–34 37–40 45 48–51 53 55–59 61–65 67–69 98 the intensities most commonly reported ranged from moderate to vigorous based on American College of Sports Medicine cutpoints.99 Specific types of activities performed included, but were not necessarily limited to, various non-video games (soccer, dodgeball, basketball, etc.), active video games, walking, running, cycling, swimming, stair climbing, jumping rope, dance and resistance training, including circuit training.13–29 31–34 36–40 42–52 54–69 98
Exercise programme characteristics*
For those studies that included resistance training and provided additional data,13 14 18 20 21 23 26–28 31 35 37 39 40 45 47 49 51 54 56 57 64 67 69 the number of sets ranged from 1 to 3 ( , 2±1, median=3), repetitions from 5 to 17 (
 , 11±5, median=11) and exercises from 3 to 13 (
 , 9±3, median=9). Types of resistance included one’s own body weight, heavy balls, elastic bands, free weights and machine weights. For the 56 studies (98.2%) that provided data on exercise delivery,13–15 17–40 42–69 98 51 (91.1%) were supervised,13–15 17–34 36–40 43–45 47–51 53–56 58–69 98 4 (7.1%) were unsupervised35 42 46 52 and 1 (1.8%) included both.57
Risk-of-bias assessment
Summary results using the Cochrane Risk of Bias Instrument82 are shown in figure 2 while study-level results are shown in online supplementary file 5. With the exception of blinding of participants and personnel, the number of studies rated as being at a high risk of bias ranged from only 2% to 18%, with 5 of the 6 items being less than 10%. All studies were considered to be at a high risk of bias for blinding of participants and personnel because it is virtually impossible to blind participants to group assignment in exercise intervention studies. In contrast, the vast majority of studies (97%) were considered to be at a low risk of bias for random sequence generation. Finally, with the exception of random sequence generation and blinding of participants and personnel, 42%–75% of studies were rated as being at an unclear risk of bias for the remaining five items.
Supplemental material

Summary results for risk of bias. Grouped risk of bias results using the Cochrane Risk of Bias Instrument.
Data synthesis
Data are reported for primary outcomes (BMI in kg/m2, fat mass and per cent body) according to (1) overall findings, (2) interval plot results, (3) ranking of treatments and (4) meta-regression results. Separate results are then reported for all secondary outcomes: body weight, fat-free mass, waist circumference, maximum oxygen consumption, systolic blood pressure, diastolic blood pressure total cholesterol, high-density lipoprotein cholesterol, low-density lipoprotein cholesterol, triglycerides, fasting glucose and insulin.
Primary outcomes
BMI (overall findings)
Data from 50 studies representing 67 effect sizes were included in the BMI in kg/m2 analyses.13–17 19–23 25–29 31–40 42–47 49 52–59 61–69 98 The network geometry plot for BMI in kg/m2 is shown in figure 3. The most common group was the control group followed by the aerobic group. The most common comparison was aerobic versus control (n=35) followed by combined aerobic and strength versus control (n=11), strength versus control (n=8), strength versus aerobic (n=7), combined aerobic and strength versus aerobic (n=4) and combined aerobic and strength versus strength (n=2). An examination for transitivity found no statistically significant differences for potential effect modifiers across treatment comparisons (p>0.05 for all, results not shown).

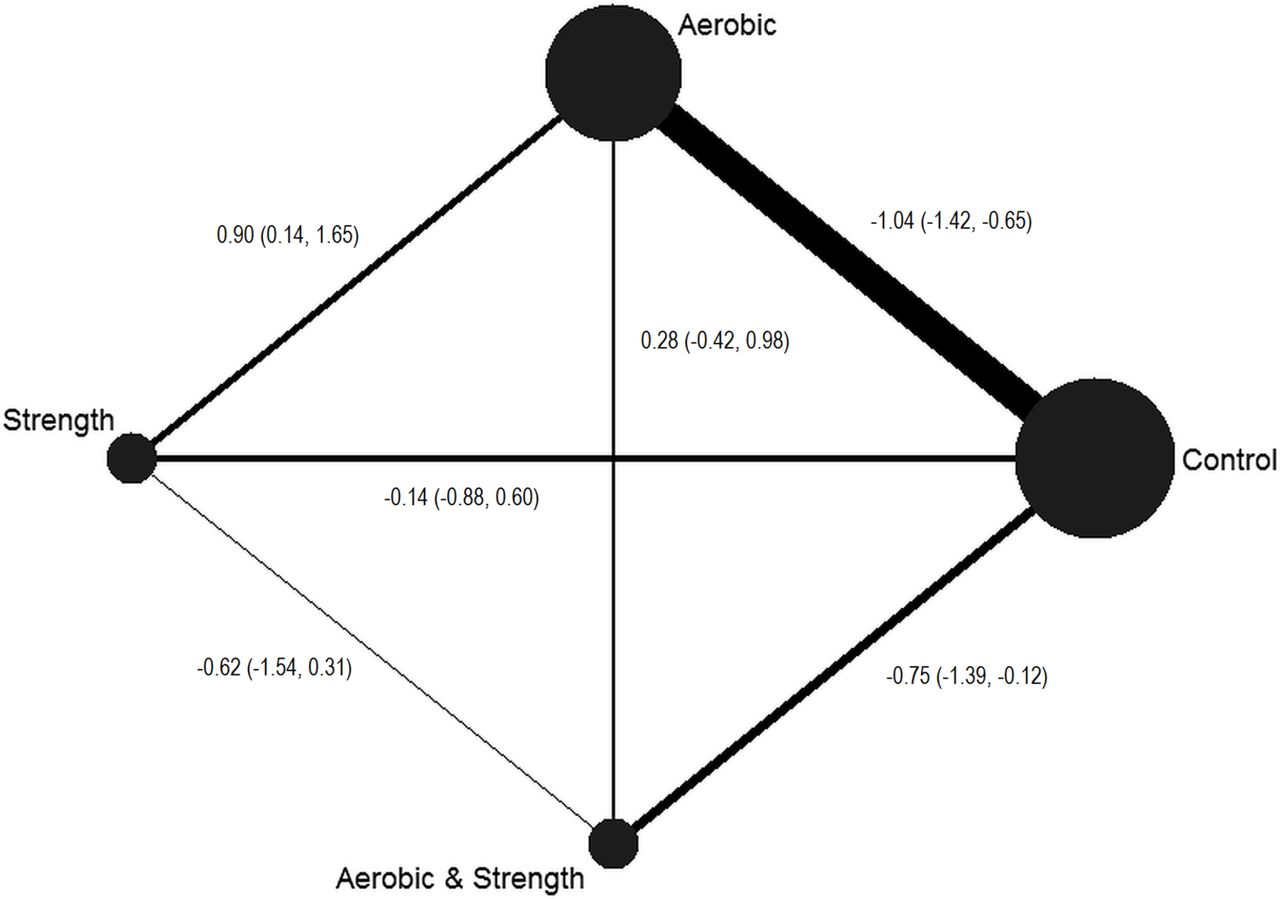
Network plot for body mass index (BMI) in kg/m2. Network plot for study comparisons included in the BMI in kg/m2 network meta-analysis. The nodes (circles) represent the different treatments while the edges (lines) represent the available direct comparisons between pairs of treatments. Both nodes and edges are weighted by the number of studies involved in each treatment and comparison, respectively. Data are presented as the mean and 95% CIs for the following comparisons: aerobic versus control, strength versus control, aerobic and strength versus control, strength versus aerobic, aerobic and strength versus aerobic, and aerobic and strength versus strength.
BMI (interval plot)
An interval plot for changes in BMI in kg/m2 is shown in figure 4 while a study-level network forest plot that includes each comparison-specific effect size can be found in online supplementary file 6. As can be seen in figure 4, non-overlapping 95% CIs for BMI in kg/m2 were observed for the aerobic versus control (n=35) as well as the combined aerobic and strength versus control comparisons (n=11; p<0.05 for both). Changes were equivalent to relative reductions of 3.8% for the aerobic versus control comparison and 2.4% for the combined aerobic and strength training versus control comparison. However, all 95% prediction intervals were overlapping. No statistically significant differences were observed for direct comparisons. In addition, the overall test for inconsistency was not statistically significant ( (7df)=4.4, p=0.74, online supplementary file 6). No statistically significant small-study effects (publication bias, etc.) were found (n=67, p=0.51, online supplementary file 7).
Supplemental material
Supplemental material

Interval plot for changes in body mass index (BMI) in kg/m2. Interval plot for changes in in BMI kg/m2 based on all pairwise comparisons. The diamond represents the point estimate, the black horizontal lines between the vertical lines the 95% CIs and the horizontal lines that extend beyond the vertical lines the 95% prediction intervals (PrI). The number of effect sizes/participants was 35/1533 (aerobic vs control), 8/331 (strength vs control), 11/426 (combined aerobic and strength vs control), 7/232 (strength vs aerobic), 4/175 (combined aerobic and strength vs aerobic) and 2/121 (combined aerobic and strength vs strength).
BMI (ranking of treatments)
The ranking of treatments for BMI in kg/m2 is shown in table 3. As can be seen, aerobic exercise had the highest probability of being ranked as the best treatment. This was followed by combined aerobic and strength training and then strength training alone.
Ranking analyses for treatments
BMI (meta-regression)
Meta-regression results, including sample sizes for these models, can be found in online supplementary file 8. For aerobic exercise, statistically significant associations (p<0.05) were found for greater reductions in BMI as a result of (1) studies conducted in countries other than those in the USA, (2) unfunded versus funded studies, (3) greater compliance to the exercise intervention, (4) greater number of total minutes of exercise per week and (5) greater number of total minutes per week of exercise after adjusting for compliance. For strength training, statistically significant associations (p<0.05) were found for greater reductions in BMI and (1) studies at a low versus unclear risk of bias with respect to participants being physically inactive prior to study initiation, (2) supervised versus unsupervised exercise and (3) facility versus home-based exercise. No other statistically significant associations were observed.
Supplemental material
Fat mass (overall findings)
Data from 31 studies representing 46 effect sizes were included in the fat mass (kg) analyses.13 14 17 18 21 23 25 27 31 34–40 42 45–48 52 55–57 59 60 64 67 69 98 The network geometry plot for fat mass (kg) is shown in figure 5. As can be seen, the control group was the most common followed by the aerobic group. The most common comparison was aerobic versus control (n=19) followed by combined aerobic and strength versus control (n=10), strength versus control (n=7), strength versus aerobic (n=7), combined aerobic and strength versus aerobic (n=4) and combined aerobic and strength versus strength (n=2) comparisons. An examination for transitivity revealed a statistically significant overall difference between comparisons for frequency of training in days per week (F (5,40df)=3.4, p=0.01). Post-hoc follow-up testing revealed that frequency of training was greater in the aerobic versus control versus combined aerobic and strength versus control comparisons (4.0 versus 2.4 days per week, p=0.008). No other statistically significant between-comparison differences were observed (p>0.05 for all, results not shown).

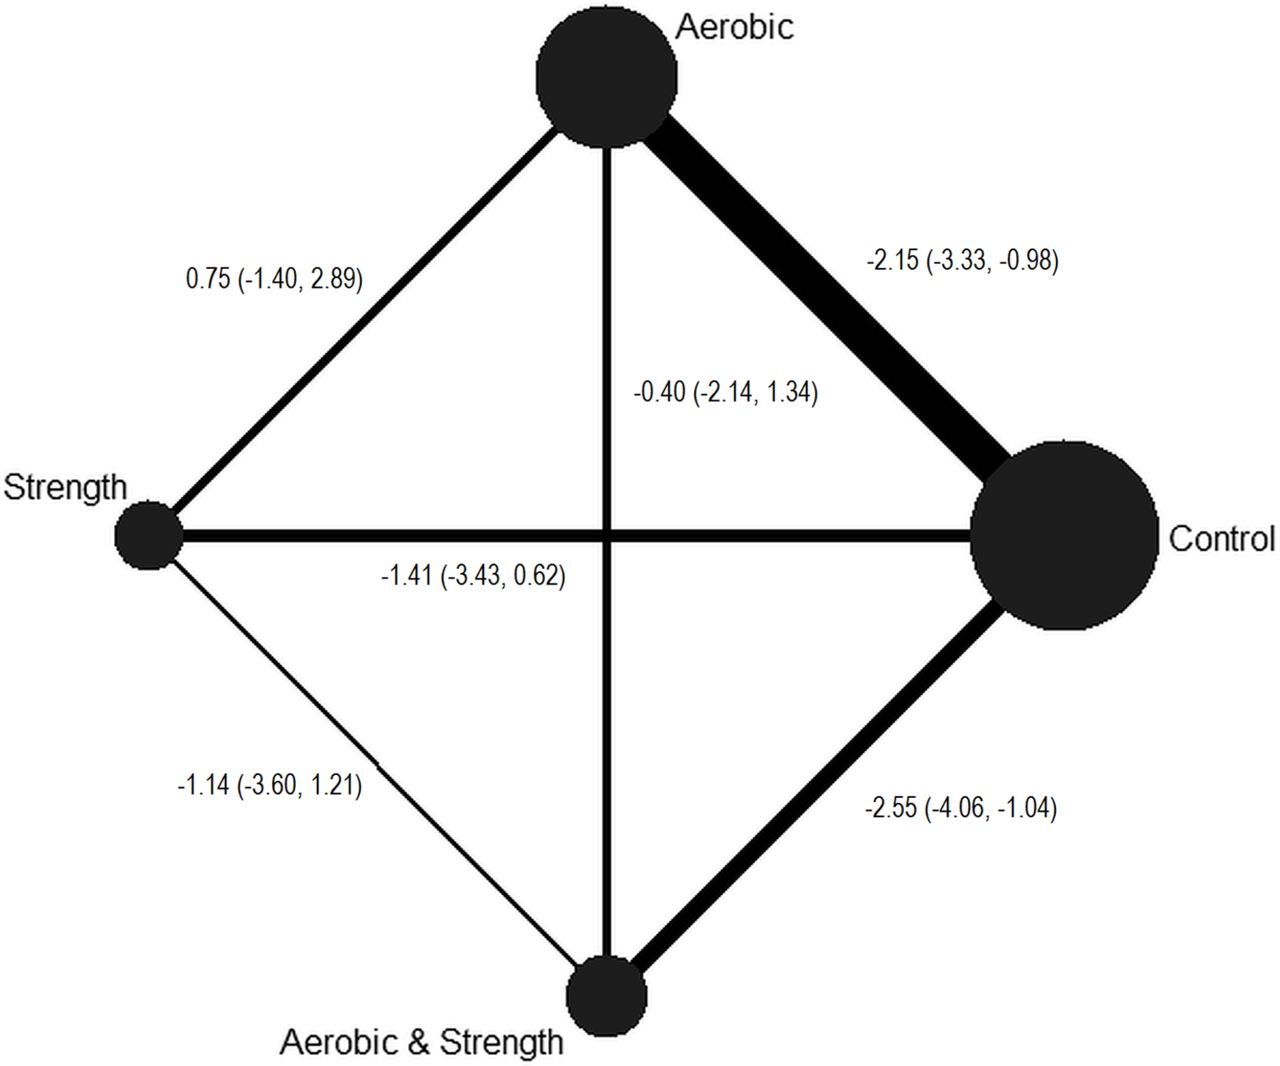
Network plot for fat mass (kg). Network plot for study comparisons included in the fat mass network meta-analysis. The nodes (circles) represent the different treatments while the edges (lines) represent the available direct comparisons between pairs of treatments. Both nodes and edges are weighted by the number of studies involved in each treatment and comparison, respectively. Data are presented as the mean and 95% CIs for the following comparisons: aerobic versus control, strength versus control, aerobic and strength versus control, strength versus aerobic, aerobic and strength versus aerobic, and aerobic and strength versus strength.
Fat mass (interval plot)
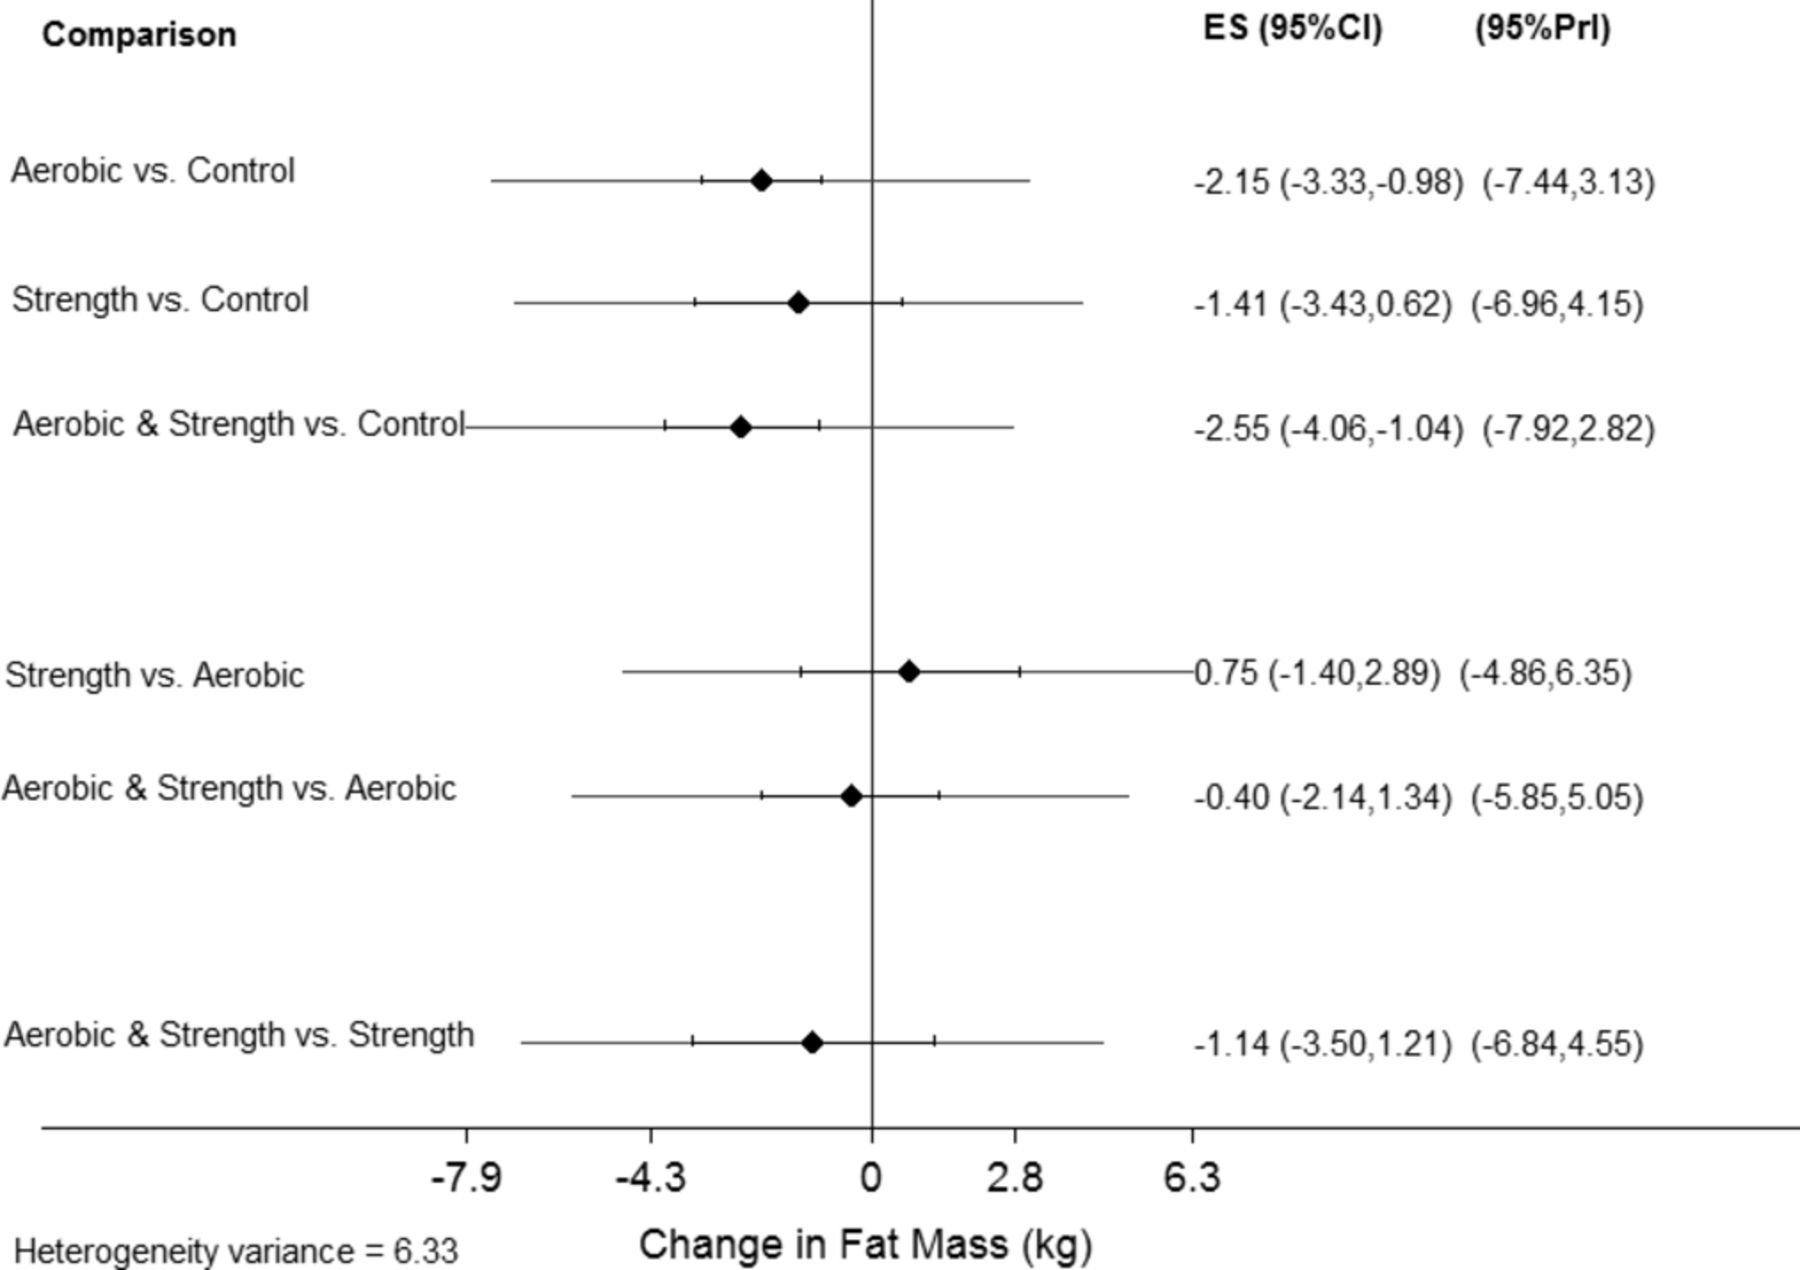
An interval plot for changes in fat mass in kg is shown in figure 6 while a network forest plot that includes each comparison-specific effect size can be found in online supplementary file 9. As can be seen by the non-overlapping 95% CIs in figure 6, statistically significant reductions in fat mass in kg were found for the aerobic versus control (n=19) as well as the combined aerobic and strength versus control comparisons (n=10; p<0.05 for both). Changes were equivalent to relative reductions of 8.3% for the aerobic versus control comparison and 8.4% for the combined aerobic and strength training versus control comparison. However, all 95% prediction intervals were overlapping. No statistically significant differences were observed for head-to-head comparisons. In addition, the overall test for inconsistency was not statistically significant ( (6df)=7.5, p=0.27, online supplementary file 9). No statistically significant small-study effects (publication bias, etc.) were found (n=46, p=0.10, online supplementary file 10).
Supplemental material
Supplemental material

Interval plot for changes in fat mass (kg). Interval plot for changes in in fat mass (kg) based on all pairwise comparisons. The diamond represents the point estimate, the black horizontal lines between the vertical lines the 95% CIs and the horizontal lines that extend beyond the vertical lines the 95% prediction intervals (PrI). The number of effect sizes/participants was 19/945 (aerobic vs control), 7/271 (strength vs control), 10/376 (combined aerobic and strength vs control), 4/167 (strength vs aerobic), 4/174 (combined aerobic and strength vs aerobic) and 2/119 (combined aerobic and strength vs strength).
Fat mass (ranking of treatments)
The ranking of treatments for fat mass in kg is shown in table 3. As can be seen, combined aerobic and strength training exercise had the highest probability of being ranked as the best treatment followed by aerobic exercise.
Fat mass (meta-regression)
Meta-regression results for fat mass (kg), including sample sizes for these models, are shown in online supplementary file 11. For aerobic exercise, statistically significant associations (p<0.05) were found for greater reductions in fat mass as a result of (1) studies at an unclear versus low risk of bias for selective reporting, (2) shorter interventions (weeks), (3) high versus moderate intensity exercise, (4) greater compliance to the exercise protocol and (5) greater total minutes per week of exercise, adjusted for compliance. For combined aerobic and strength training, statistically significant associations (p<0.05) were found for greater reductions in fat mass and more recent year of publication as well as unfunded versus funded studies. No other statistically significant associations were observed.
Supplemental material
Per cent body fat (overall findings)
Data from 45 studies representing 64 effect sizes were included in the per cent body fat analyses.13 14 18–24 26 28–32 34–37 39 40 42 44–48 50–61 63 64 67–69 98 The network plot for fat mass (kg) is shown in figure 7. As can be seen, the control group was the most common followed by the aerobic group. The most common comparison was the aerobic versus control group (n=32) followed by combined aerobic and strength versus control (n=12), strength versus control (n=8), strength versus aerobic (n=6), combined aerobic and strength versus aerobic (n=4), and combined aerobic and strength versus strength (n=2) comparisons. An examination for transitivity revealed a statistically significant difference between comparisons with respect to the method used for the assessment of per cent body fat ( (25df)=43.7, p=0.01). Post-hoc follow-up testing revealed that the difference was between the aerobic versus control and strength versus control comparisons (
 (4df)=12.7, p=0.01) as well as aerobic versus control and combined aerobic and strength training versus aerobic comparisons (
 (5df)=12.3, p=0.03). In addition, frequency of training was associated with specific comparisons (F (5, 58df)=2.9, p=0.02). Post-hoc follow-up testing showed that frequency of training was lower in the combined aerobic and strength training comparison (2.6 days per week) versus the aerobic and control comparison (3.8 days per week, p=0.02). No other statistically significant between-comparison differences were observed (p>0.05 for all).

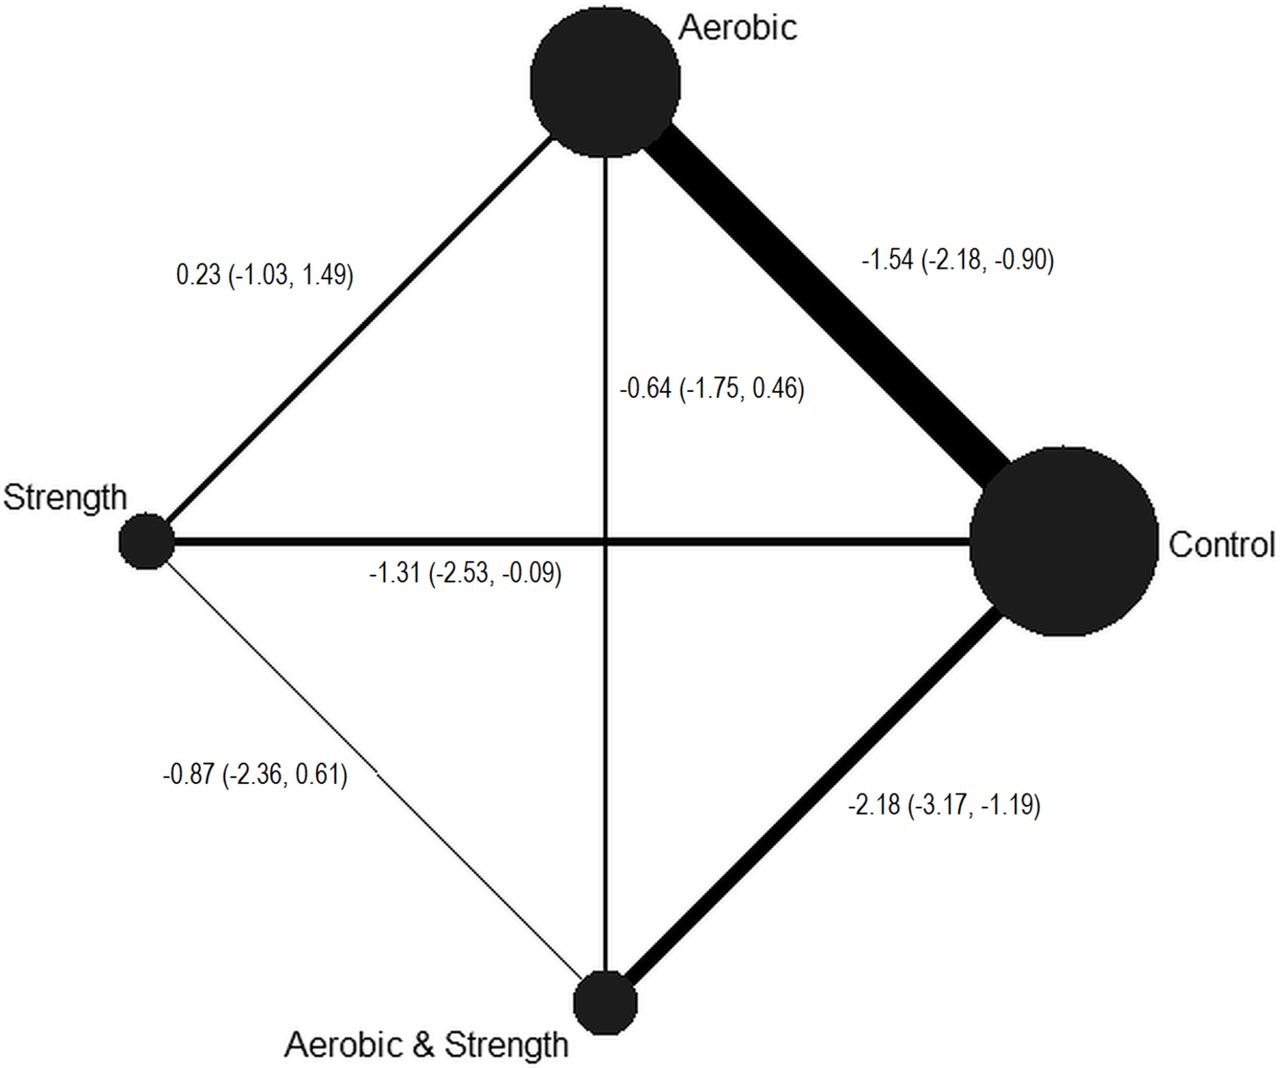
Network plot for per cent body fat. Network plot for study comparisons included in the per cent body fat network meta-analysis. The nodes (circles) represent the different treatments while the edges (lines) represent the available direct comparisons between pairs of treatments. Both nodes and edges are weighted by the number of studies involved in each treatment and comparison, respectively. Data are presented as the mean and 95% CIs for the following comparisons: aerobic versus control, strength versus control, aerobic and strength versus control, strength versus aerobic, aerobic and strength versus aerobic, and aerobic and strength versus strength.
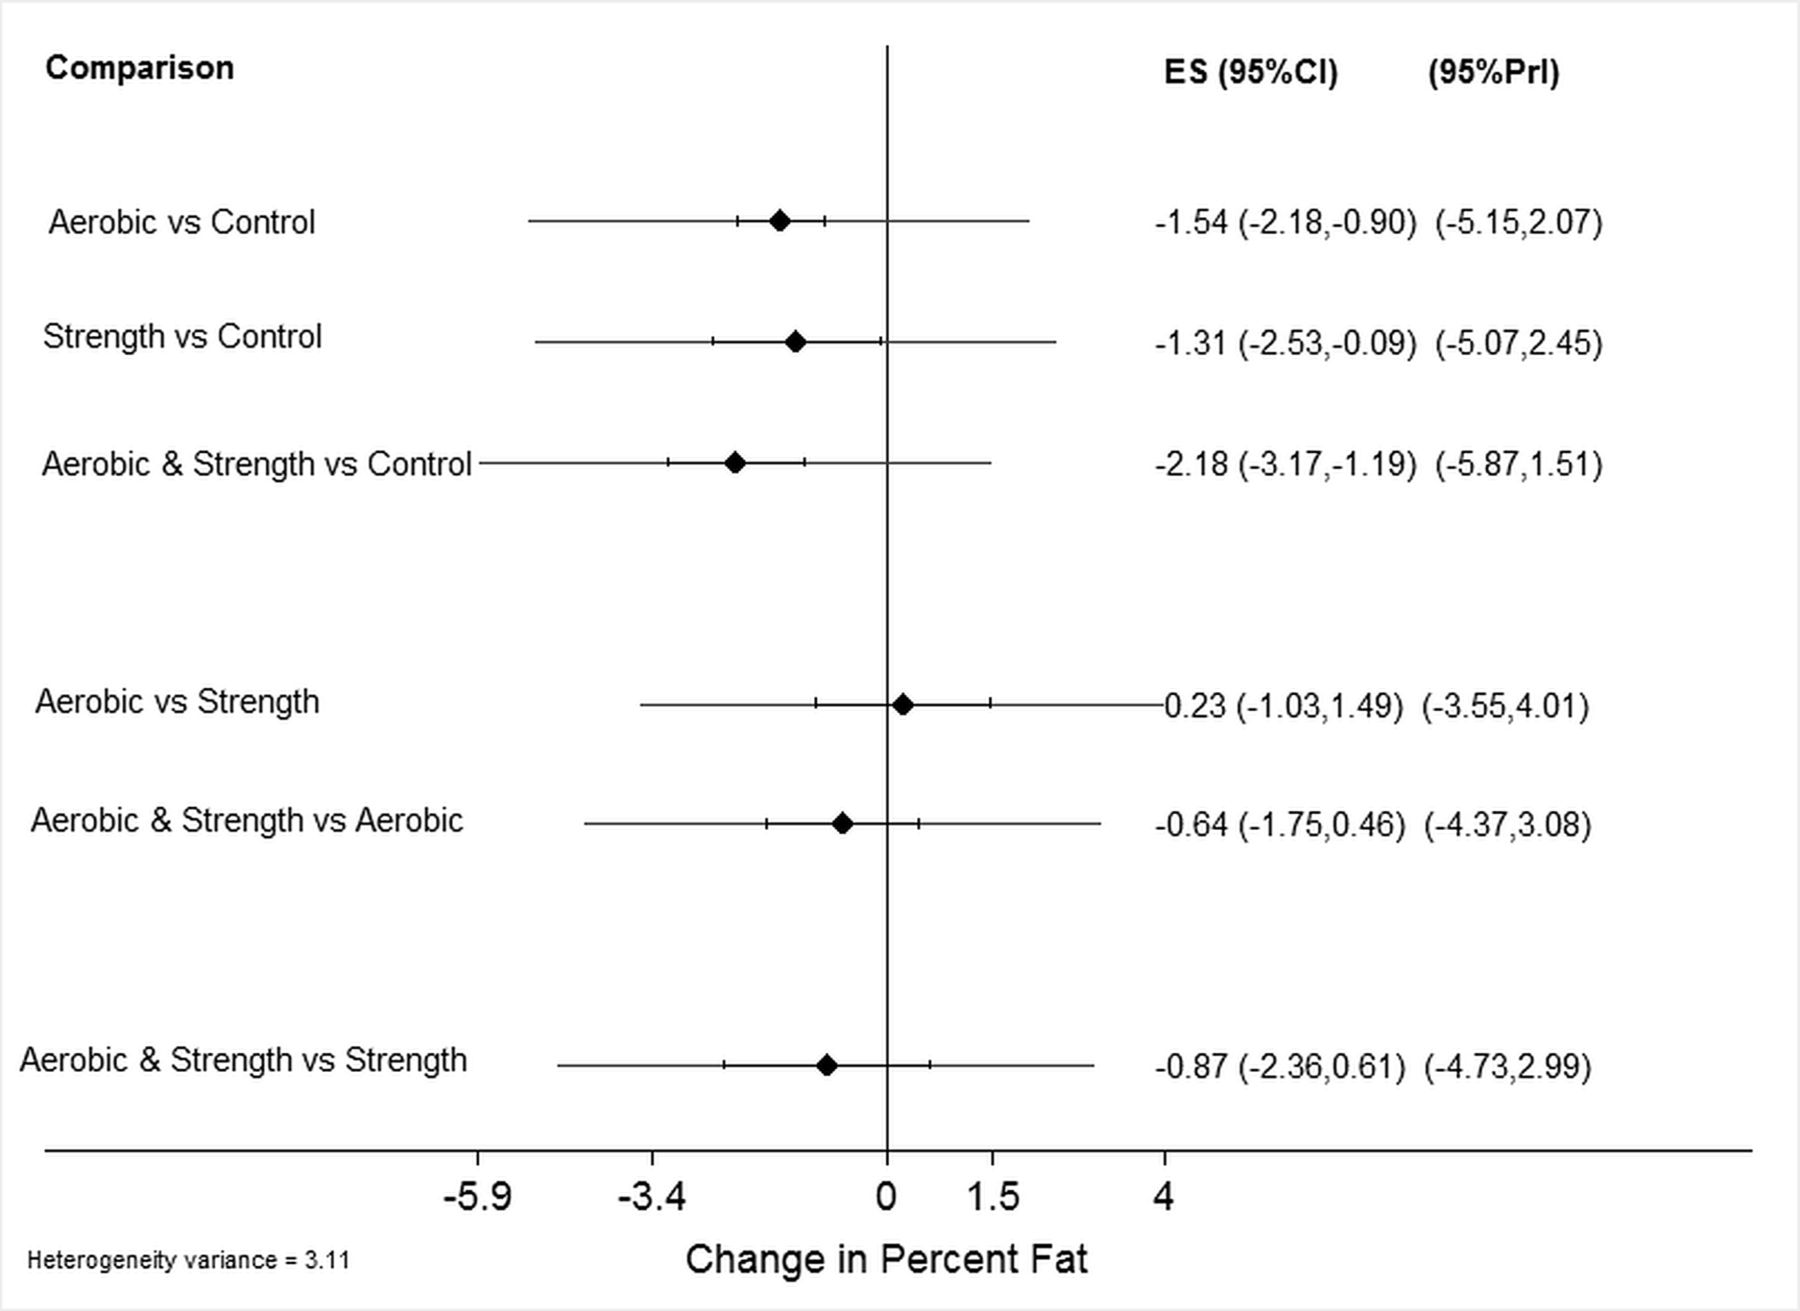
Per cent body fat (interval plot)
An interval plot for changes in per cent body fat is shown in figure 8 while a network forest plot that includes each comparison-specific effect size can be found in online supplementary file 12. As can be seen by the non-overlapping 95% CIs in figure 8, statistically significant reductions (p<0.05) in per cent body fat were found for the aerobic versus control (n=32), strength versus control (n=8) and combined aerobic and strength versus control comparisons (n=12)). Changes were equivalent to relative reductions of 5.4% for the aerobic versus control comparison, 2.8% for the strength versus control comparison and 6.0% for the combined aerobic and strength training versus control comparison. However, all 95% prediction intervals were overlapping. No statistically significant differences were observed for direct comparisons. In addition, the overall test for inconsistency was not statistically significant ( (7df)=11.9, p=0.10, online supplementary file 12). No statistically significant small-study effects (publication bias, etc.) were found (n=64, p=0.65, online supplementary file 13).
Supplemental material
Supplemental material

Interval plot for changes in per cent body fat. Interval plot for changes in per cent body fat based on all pairwise comparisons. The diamond represents the point estimate, the black horizontal lines between the vertical lines the 95% CIs and the horizontal lines that extend beyond the vertical lines the 95% prediction intervals (PrI). The number of effect sizes/participants was 32/1602 (aerobic vs control), 8/327 (strength vs control), 12/480 (combined aerobic and strength vs control), 6/201 (strength vs aerobic), 4/174 (combined aerobic and strength vs aerobic) and 2/119 (combined aerobic and strength vs strength).
Percent body fat (ranking of treatment)
The ranking of treatments for per cent body fat is shown in table 3. As can be seen, combined aerobic and strength training exercise had the highest probability of being ranked as the best treatment followed by aerobic exercise alone and strength training alone.
Per cent body fat (meta-regression)
Meta-regression results for per cent body fat, including sample sizes for statistically significant results, are shown in online supplementary file 14. For aerobic exercise, statistically significant associations (p<0.05) were found for greater reductions in per cent body fat as a result of (1) studies at an unclear versus low risk of bias for selective reporting, (2) unfunded versus funded studies and (3) shorter interventions (weeks). For strength training, greater reductions were associated with low versus unclear risk of bias for participants being physically active prior to study initiation as well as unfunded versus funded studies. For combined aerobic and strength training, greater reductions in per cent body fat were associated with unfunded versus funded studies. No other statistically significant associations were observed.
Supplemental material
Secondary outcomes
The overall results for secondary outcomes are shown in online supplementary file 15.
Supplemental material
Body weight
Statistically significant reductions in body weight were observed for both aerobic exercise and combined aerobic and strength training. However, 95% prediction intervals for all comparisons included zero. Changes were equivalent to relative reductions of 3.0% and 4.0%, respectively, for aerobic and combined exercise. In addition, greater reductions were observed for the combined aerobic and strength versus strength training only comparison ( , −1.7, 95% CI −3.3 to −0.07). The global test for inconsistency was not statistically significant (
 (7df)=10.5, p=0.16). Statistically significant small-study effects (publication bias, etc.) were observed (n=67, p=0.002). For ranking of treatments, aerobic exercise was ranked as the best treatment followed by combined aerobic and strength training.
Fat-free mass
Statistically significant increases in fat-free mass (kg) were observed for combined aerobic exercise and strength training but none of the other interventions. However, 95% prediction intervals for all comparisons included zero. Changes were equivalent to relative increases of 2.5%. In addition, increases in fat-free mass were greater for combined aerobic and strength versus aerobic comparisons ( , 1.2, 95% CI 0.1 to 2.3). The global test for inconsistency was not statistically significant (
 (7df)=2.8, p=0.90). Statistically significant small-study effects (publication bias, etc.) were observed (n=45, p=0.008). For ranking of treatments, combined aerobic and strength training was ranked first for increasing fat-free mass.
Waist circumference
Statistically significant reductions in waist circumference were found for aerobic exercise. However, 95% prediction intervals for all comparisons included zero. Changes were equivalent to relative reductions of 2.2%. No statistically significant differences were observed for head-to-head comparisons (p<0.05 for all). The global test for inconsistency was not statistically significant ( (6df)=8.1, p=0.23). No statistically significant small-study effects (publication bias, etc.) were observed (n=36, p=0.39). For ranking of treatments, combined aerobic and strength training was ranked first followed by aerobic exercise.
Maximum oxygen consumption
Statistically significant increases were found for VO2max in mL/kg/min as a result of either aerobic exercise or combined aerobic exercise and strength training. However, 95% prediction intervals for all comparisons included zero. Changes were equivalent to relative increases of 12.2% and 8.9%, respectively, for aerobic exercise and combined aerobic and strength exercise. No statistically significant differences were observed for the three direct comparisons. The global test for inconsistency was also not statistically significant ( (6df)=10.0, p=0.12). No statistically significant small-study effects (publication bias, etc.) were observed (n=47, p=0.32). For ranking of treatments, combined aerobic exercise was ranked first while combined aerobic and strength training was ranked second.
Systolic blood pressure
Statistically significant decreases were found for resting systolic blood pressure as a result of aerobic exercise. However, 95% prediction intervals for all comparisons included zero. Changes were equivalent to a relative reduction of 3.5%. No statistically significant differences were observed for the head-to-head comparisons. The global test for inconsistency was not statistically significant ( (4df)=2.0, p=0.74). Statistically significant small-study effects (publication bias, etc.) were observed (n=24, p=0.01). For ranking of treatments, aerobic exercise was ranked first.
Diastolic blood pressure
Statistically significant decreases for resting diastolic blood pressure were found as a result of aerobic exercise. However, the 95% prediction intervals for all comparisons included zero. Changes were equivalent to a relative reduction of 3.4%. No statistically significant differences were observed for any of the head-to-head comparisons. The global test for inconsistency was not statistically significant ( (4df)=0.53, p=0.97). Statistically significant small-study effects (publication bias, etc.) were observed (n=23, p=0.001). For ranking of treatments, aerobic exercise was ranked first.
Total cholesterol
Statistically significant decreases in total cholesterol were found as a result of aerobic exercise but none of the other interventions. However, the 95% prediction intervals for all comparisons included zero. Changes were equivalent to a relative reduction of 3.3%. No statistically significant differences were observed for the three head-to-head comparisons. The global test for inconsistency was not statistically significant ( (5df)= 1.8, p=0.87). Furthermore, no statistically significant small-study effects (publication bias, etc.) were observed (n=28, p=0.70). For treatment rankings, aerobic exercise was ranked as the best.
High-density lipoprotein cholesterol
Statistically significant increases were found for high-density lipoprotein cholesterol as a result of aerobic exercise only. Conversely, the 95% prediction intervals for all comparisons included zero. Changes were equivalent to relative increases of 7.4%. No statistically significant differences were observed for any of the direct comparisons. The global test for inconsistency was not statistically significant ( (5df)=2.6, p=0.76). Statistically significant small-study effects (publication bias, etc.) were observed (n=31, p=0.04). For treatment rankings, combined aerobic exercise was ranked as the best.
Low-density lipoprotein cholesterol
Statistically significant decreases in low-density lipoprotein cholesterol were found as a result of aerobic exercise but none of the other interventions. In addition, the 95% prediction interval did not include zero. Changes were equivalent to a relative reduction of 6.0%. No statistically significant differences were observed for the three head-to-head comparisons. The global test for inconsistency was not statistically significant ( (5df)=2.4, p=0.79). Statistically significant small-study effects (publication bias, etc.) were observed (n=30, p=0.006). For treatment rankings, aerobic exercise was ranked as the best.
Triglycerides
Statistically significant decreases in triglycerides were found as a result of aerobic exercise as well as combined aerobic and strength exercise. In addition, the 95% prediction intervals did not include zero for both treatments. Changes were equivalent to a relative reduction of 11.9% as a result of aerobic exercise and 14.4% as a result of combined aerobic and strength exercise. No statistically significant differences were observed for the three head-to-head comparisons. The global test for inconsistency was not statistically significant ( (5df)=1.4, p=0.92). No statistically significant small-study effects (publication bias, etc.) were observed (n=30, p=0.44). For treatment rankings, aerobic exercise was ranked the best, followed by combined aerobic and strength training.
Fasting glucose
Statistically significant decreases in fasting glucose were found as a result of combined aerobic and strength exercise. In addition, the 95% prediction interval did not include zero. Changes were equivalent to a relative reduction of 6.1%. For head-to-head comparisons, decreases were greater for combined aerobic and strength versus strength-only interventions ( , −4.9, 95% CI −9.5 to −0.2). The global test for inconsistency was not statistically significant (
 (6df)=2.2, p=0.90). No statistically significant small-study effects (publication bias, etc.) were observed (n=37, p=0.35). For treatment rankings, combined aerobic and strength training was ranked as the best.
Fasting insulin
Statistically significant decreases in fasting insulin were observed for aerobic exercise, strength exercise and combined aerobic and strength exercise as a result of combined aerobic and strength exercise. In addition, the 95% prediction intervals did not include zero for any of the three intervention types. Changes were equivalent to relative reductions of 21.2% (aerobic exercise), 22.6% (strength exercise) and 17.1% (combined aerobic and strength exercise). No statistically significant differences were observed for the three head-to-head comparisons. The global test for inconsistency was not statistically significant ( (7df)=5.6, p=0.59). However, statistically significant small-study effects (publication bias, etc.) were observed (n=33, p=0.008). For treatment rankings, combined aerobic and strength training was ranked as the best, followed by strength training and aerobic exercise.
Discussion
Overall findings for primary outcomes
The primary purpose of the current study was to conduct a network meta-analysis of randomised trials on the effects of exercise (aerobic, strength training or both) on adiposity outcomes (BMI in kg/m2, fat mass, per cent fat) in overweight and obese children and adolescents. The overall findings suggest that exercise is associated with statistically significant reductions in all three primary outcomes. More specifically, aerobic exercise as well as combined aerobic and strength exercise was shown to decrease BMI in kg/m2, fat mass and per cent fat while decreases as a result of strength training interventions were limited to per cent fat only. Of the three exercise interventions, combined aerobic and strength exercise was ranked as the best for reducing fat mass and per cent fat while aerobic exercise was ranked the best for reducing BMI in kg/m2. These findings are further strengthened by the lack of global inconsistency for all three primary outcomes as well as the lack of small-study effects (publication bias, etc.) observed for all three adiposity outcomes. Alternatively, the positive findings could be questioned given the overlapping 95% prediction intervals across all three treatments. These findings suggest that in a future setting, some participants would benefit while others would not.100
A major question to address is the clinical importance of the observed changes in adiposity as a result of exercise. Generally, reductions in adiposity of at least 5% may be considered clinically important.101 Using this threshold, none of the treatments that were found to be statistically significant in the current study would meet this cutpoint for changes in BMI in kg/m2. However, the reductions in fat mass as a result of aerobic exercise (8.3%) as well as combined aerobic and strength exercise (8.4%) appear to be clinically important. In addition, the reductions observed for per cent body fat as a result of aerobic exercise (5.4%) as well as combined aerobic and strength exercise (6.0%) also appear to be clinically important. Thus, clinically relevant benefits were derived when more direct measures of adiposity (fat mass and per cent body fat) were used.
Meta-regression findings
Simple meta-regression analyses yielded several statistically significant associations for those treatments and outcomes in which the overall findings were statistically significant. First, the statistically significant association between greater reductions in BMI in kg/m2 as a result of aerobic exercise for studies conducted in countries other than the USA may reflect a tendency for other countries to submit studies that yield larger improvements in BMI in kg/m2. Alternatively, this association may be confounded by other factors. For example, differences in diet and exercise102 habits between the USA and other countries have been shown to exist, something that would appear plausible given the magnitude of the obesity problem in the USA.1 Second, greater reductions as a result of aerobic exercise for both BMI in kg/m2 and per cent fat were associated with unfunded versus funded studies. This same association was found for fat mass and per cent body fat congruent with combined aerobic and strength training interventions as well as for per cent body fat and strength training. One possible and broad explanation for these associations may be that funded studies are of higher quality than unfunded studies. Third, greater compliance, defined as the percentage of exercise sessions attended, was associated with greater reductions in both BMI in kg/m2 as well as fat mass as a result of aerobic exercise. These associations appear plausible given that greater reductions should be expected if exercise attendance is greater. Fourth, greater reductions in BMI in kg/m2 were associated with greater total minutes of exercise per week as a result of aerobic exercise. When adjusted for compliance, total minutes of exercise per week were also associated with greater reductions in both BMI in kg/m2 and fat mass as a result of aerobic exercise. These observed associations seem quite plausible. Fifth, larger reductions in both fat mass and per cent fat were associated with studies that were at an unclear versus low risk of bias for selective reporting of study results. This might suggest a tendency for authors to selectively report results that are statistically significant. However, caution is warranted in the interpretation of these findings since a rating of unclear does not guarantee that selective reporting of results occurred, but rather, reflects a lack of available data to classify a study as either high or low risk. Sixth, the association between greater reductions in fat mass and per cent fat as a result of shorter intervention length, that is, weeks, as a result of aerobic exercise may represent a certain threshold in which no further benefits can be achieved. However, maintaining an exercise programme is probably important as the cessation of training will most likely return adiposity levels back to their original values. Seventh, the association between greater reductions in fat mass as a result of high versus moderate-intensity aerobic exercise suggests that training regimes such as interval training may be optimal for reducing fat mass. However, this needs to be balanced with the possibility of placing the child and adolescent at an increased risk for injury as well as possible concerns about decreased compliance with high-intensity exercise programmes. Eighth, the association between greater reductions in fat mass and more recent year of publication as a result of combined aerobic and strength exercise may reflect higher quality studies. In contrast, this may reflect an increased emphasis on investigators tending to report results that are large and statistically significant. Finally, the greater strength training reductions in per cent fat as a result of studies that were at a low versus unclear risk of bias for participants not being physically active prior to study participation reflect the belief that those who are least active have the most to gain from an exercise programme. Again, however, a rating of unclear does not guarantee that subjects were physically active prior to study participation, but rather, reflects a lack of available data to classify a study as being at either a high or low risk of bias.
Overall findings for secondary outcomes
Across all three treatments, statistically significant improvements were observed for secondary outcomes. For aerobic exercise, these included reductions in body weight, waist circumference, resting systolic and diastolic blood pressure, total cholesterol, low-density lipoprotein cholesterol, triglycerides and fasting insulin, as well as increases in VO2max in mL/kg/min and high-density lipoprotein cholesterol. For strength training, statistically significant reductions were limited to fasting insulin while combined aerobic and strength training resulted in statistically significant improvements in body weight, fat free mass, VO2max in mL/kg/min, triglycerides, fasting glucose and fasting insulin. Thus, unlike most pharmacological interventions that are intended to target one condition and often include significant side effects, exercise, especially aerobic as well as combined aerobic and strength training, can yield significant improvements in both adiposity outcomes as well as a number of other outcomes in overweight and obese children and adolescents.
Implications for research
There are several implications for reporting future randomised trials on exercise and adiposity in overweight and obese children and adolescents. First, given that reductions in adiposity are dependent on the balance between energy intake and expenditure, future randomised trials should track and report data on both energy intake and expenditure so that the independent effects of exercise on adiposity can be better quantified. Second, future studies should track and report the total physical activity levels of participants during the entire day in order to ensure that physical activity compensation is not occurring.103 Third, a clear definition and accurate reporting of adverse events are needed so that the benefits and potential harms of exercise on adiposity in overweight and obese children can be more clearly delineated. Fourth, in order to better assess the quality of the study design, information should be provided about allocation concealment, blinding of outcome assessors, incomplete outcome data and reporting, as well as the physical activity levels of participants prior to taking part in the study. Fifth, given that less than half of the studies provided data on compliance to the exercise intervention, future studies should report this information since it can have a significant impact on outcomes. Along those lines, it is suggested that researchers adhere to the Consensus on Exercise Reporting Template when designing their study and reporting exercise programme information from their clinical trials.104 Sixth, while none of the studies included waist-to-height ratio as an outcome and it was not part of our a priori protocol, future original studies may want to consider the inclusion of such given that it has been shown to be an accurate predictor105 and correlate106 of cardiometabolic risk in children and adolescents.
In addition to reporting, there are several suggestions for the conduct of future research addressing the effects of exercise interventions on adiposity outcomes in overweight and obese children and adolescents. First, given the small number of direct studies included, a need exists for additional randomised trials that examine the effects of different exercise interventions head to head, as was done in the study by Sigal et al.57 Ideally, this would include an aerobic, strength and combined aerobic and strength training group as well as a control group. Such an approach would provide additional and possibly more valid information regarding the effects of each intervention on adiposity outcomes. Second, given the lack of follow-up data, a need exists for future studies that include follow-up assessment several weeks and/or months after the intervention period has ended. This would allow one to track both changes in adiposity outcomes as well as continued participation in exercise. Third, given the potential of calorie restriction for improving adiposity outcomes and the need to identify the best treatment, a need exists for a network meta-analysis that includes the following treatment arms: exercise, calorie restriction, exercise and calorie restriction, control. This would allow one to examine both the separate and combined effects of exercise and caloric restriction on adiposity outcomes in overweight and obese children and adolescents. In addition, research that includes a transition to a diet without processed foods107 as well as sweetened beverages108 would also be worthy of investigating. Finally, a need exists for cost-effectiveness analyses.
Implications for practice
The results of the current network meta-analysis have important implications for practice. First, given the statistically significant and clinically important improvements in adiposity outcomes, lack of adverse events for those that reported such data, and improvements observed for a number of secondary outcomes, exercise may be more vital than any other type of intervention for the overall physiological health of overweight and obese children and adolescents. While the current network meta-analysis was unable to determine the exact dose−response effects of exercise on adiposity in overweight and obese children and adolescents, it would appear reasonable to suggest that aerobic or combined aerobic and strengthening exercise would be optimal. Along those lines, it is suggested that adherence to the recent 2018 guidelines for exercise and physical activity in children and adolescents be followed.109 These include at least 60 min per day of moderate-to-vigorous physical activity, including a minimum of 3 days of vigorous intensity activity, as well as muscle-strengthening activities at least 3 days per week.109 More broadly, it is recommended that clinicians and other healthcare practitioners adhere to the recent recommendations from the United States Preventive Service Task Force regarding screening for obesity in children and adolescents.101 These recommendations include screening for obesity in children and adolescents>6 years of age and offering or referring them to comprehensive, intensive behavioural interventions to promote improvements in weight status.101 Multicomponent behavioural interventions that include, but are not necessarily limited to, exercising, healthy eating and reductions in screen time may be optimal.101 Reducing adiposity in overweight and obese children and adolescents will probably require intensive efforts given the obesogenic environments in which most people reside today.
Implications for policy
Evidence-based policies play a pivotal role in reducing childhood obesity.110 The results of the current network meta-analysis provide evidence to support policies aimed at increasing the exercise and physical activity habits of overweight and obese children and adolescents. This is especially relevant for policy given that one of the main reasons for conducting a network meta-analysis is to identify the best treatment(s) for a disease or condition. Broadly, the development of policies aimed at making exercise and physical activity safer, easier and more appealing might be the best.110 More specifically, policies directed towards increasing active transportation and recreation as well as reducing sedentary behaviour are probably important.110 In addition, and most pertinent to the current network meta-analysis, policies aimed at increasing the number of overweight and obese children and adolescents who participate in exercise and physical activity programmes that include aerobic and strength training according to current guidelines109 are probably relevant. Finally, policies aimed at increasing exercise and physical activity for reducing childhood obesity should probably work in concert with food policies that aim to do the same.110
Strengths and limitations
There are several strengths to this study. First, to the best of the investigative team’s knowledge, this is the largest as well as first systematic review to use the network meta-analytic approach to determine the effects as well as hierarchy of exercise interventions (aerobic, strength training or both) on BMI in kg/m2, fat mass and per cent body fat in overweight and obese children and adolescents. This work is important for determining which type of exercise treatment(s) is/are best for reducing adiposity. Second, the results of this systematic review with network meta-analysis should be useful to researchers with respect to the conduct and reporting of future research on this topic, including priority areas. Third, the findings of the current study should be useful to practitioners and policy-makers for making more informed decisions regarding the use of exercise in the treatment of overweight and obesity in children and adolescents. For example, clinicians and other healthcare personnel can include this information along with their own clinical judgement and parent/child preferences when making evidence-based decisions regarding the use of exercise in the treatment of adiposity in overweight and obese children and adolescents.
In addition to strengths, there are also several potential limitations. First, the number of effect sizes for some treatments and comparisons, for example, strength training and fat mass, was small. As a result, there may have been a lack of statistical power to detect a true effect, assuming such an effect exists. Second, the results could have been affected by the different criteria used across the studies for determining overweight and obesity. In addition, since many studies used BMI to determine overweight and obesity, one or more studies may have excluded some eligible children and adolescents given that BMI has been shown to fail to identify more than 25% of children with excess body fat percentage.111 Third, common to any type of aggregate data meta-analysis, meta-regression results do not support causal inferences because the included studies are not randomly assigned to covariates.112 Thus, any of the associations observed in the current network meta-analysis should be tested in original randomised controlled trials. Fourth, because a large number of statistical tests were conducted, some of the statistically significant results observed may have been nothing more than the play of chance. However, common to most aggregate data meta-analyses, no adjustments for multiple testing were made because of concerns about missing possibly important findings that could be tested in original randomised controlled trials.113 Fifth, the results for the secondary outcomes in the current study may be a biased sample since studies were only included if one or more measures of adiposity, our primary outcomes, were assessed. Finally, common to all aggregate data meta-analyses, there is the possibility of ecological fallacy, that is, that group averages are not reflective of an individual’s values for variables that were reported on the group vs individual level.114
Conclusions
The findings of the current network meta-analysis suggest that aerobic exercise as well as combined aerobic and strength training exercise is associated with clinically important reductions in selected measures of adiposity.
References
- 1.↵
- 2.↵
- 3.↵
- 4.↵
- 5.↵
- 6.↵
- 7.↵
- 8.↵
- 9.↵
- 10.↵
- 11.↵
- 12.↵
- 13.↵
- 14.↵
- 15.↵
- 16.↵
- 17.↵
- 18.↵
- 19.↵
- 20.↵
- 21.↵
- 22.↵
- 23.↵
- 24.↵
- 25.↵
- 26.↵
- 27.↵
- 28.↵
- 29.↵
- 30.↵
- 31.↵
- 32.↵
- 33.↵
- 34.↵
- 35.↵
- 36.↵
- 37.↵
- 38.↵
- 39.↵
- 40.↵
- 41.↵
- 42.↵
- 43.↵
- 44.↵
- 45.↵
- 46.↵
- 47.↵
- 48.↵
- 49.↵
- 50.↵
- 51.↵
- 52.↵
- 53.↵
- 54.↵
- 55.↵
- 56.↵
- 57.↵
- 58.↵
- 59.↵
- 60.↵
- 61.↵
- 62.↵
- 63.↵
- 64.↵
- 65.↵
- 66.↵
- 67.↵
- 68.↵
- 69.↵
- 70.↵
- 71.↵
- 72.↵
- 73.↵
- 74.↵
- 75.↵
- 76.↵
- 77.↵
- 78.↵
- 79.↵
- 80.↵
- 81.↵
- 82.↵
- 83.↵
- 84.↵
- 85.↵
- 86.↵
- 87.↵
- 88.↵
- 89.↵
- 90.↵
- 91.↵
- 92.↵
- 93.↵
- 94.↵
- 95.↵
- 96.↵
- 97.↵
- 98.↵
- 99.↵
- 100.↵
- 101.↵
- 102.↵
- 103.↵
- 104.↵
- 105.↵
- 106.↵
- 107.↵
- 108.↵
- 109.↵
- 110.↵
- 111.↵
- 112.↵
- 113.↵
- 114.↵
Footnotes
Contributors GAK is the guarantor. All authors drafted the manuscript. All authors contributed to the development of the data sources to search for relevant literature, including search strategy, selection criteria, data extraction criteria and risk-of-bias assessment strategy. GAK provided statistical expertise while RRP provided content expertise on exercise and adiposity in overweight and obese children and adolescents. All authors read, provided feedback and approved the final manuscript.
Funding This study was funded by the American Heart Association, Grant #17GRNT33630158 (GAK, Principal Investigator).
Disclaimer The content of this manuscript is solely the responsibility of the authors and does not necessarily represent the official views of the American Heart Association.
Competing interests None declared.
Patient consent for publication Not required.
Provenance and peer review Not commissioned; externally peer reviewed.
Data availability statement Data are available upon reasonable request.