Article Text

Abstract
Objective To analyse the secular trends in mean value and distribution of weight, height and weight for height in children under 7 years in developed regions in China.
Design Five repeated cross-sectional surveys were conducted using the same methods at the same sites during 1975–2015.
Setting Nine cities in northern, central and southern regions of China.
Population Healthy children under 7 years; the sample sizes were 94 496 in 1975, 79 177 in 1985, 79 152 in 1995, 69 760 in 2005 and 83 583 in 2015.
Main outcome measures Weight and height were measured by the same methods in the five surveys.
Results The increasing trends in the mean value of weight, height and weight for height were observed and their distribution was found to have shifted upwards. There were unbalanced increments in various centiles and the relative increments in the 3rd centile of height for children under 7 years were larger than those in the 50th and 97th centiles. Although the relative increments in the 3rd centile of weight for children under 2 years were larger than those in the 50th and 97th centiles, the increments in the 97th centile for children older than 2 years became the largest compared with other centiles. The changes in each centile of weight for height were similar with those of weight. The annual increments of height and weight increased over time and were more significant between birth and 2 years of age for height and between ages 4 years and 6 years for weight. The per-decade increments in 1975–1985, 1985–1995 and 1995–2005 became larger, while those in 2005–2015 slowed down.
Conclusions The rapid increasing trends of weight, height and weight for height had slowed down since 2005 in developed regions of China. The relative increments in the low centile of height were more significant, while the high centile of weight and weight for height increased more significantly in older children.
- children
- weight
- height
- weight for height
- distribution
- secular changes
- China
This is an open access article distributed in accordance with the Creative Commons Attribution Non Commercial (CC BY-NC 4.0) license, which permits others to distribute, remix, adapt, build upon this work non-commercially, and license their derivative works on different terms, provided the original work is properly cited, appropriate credit is given, any changes made indicated, and the use is non-commercial. See: http://creativecommons.org/licenses/by-nc/4.0/.
Statistics from Altmetric.com
Strengths and limitations of this study
The series of surveys with the same method in the same sites, spanned 40 years, when China’s social economy had undergone the rapid development and transformation.
Changes in the third, fiftieth and ninety-seventh centiles would illustrate the trends in the distribution of height, weight and weight for height at the population level, which would provide more data for public health promotion.
The changes in the annual increments in physical growth, calculated using data from five cross-sectional surveys, could roughly illustrate the growth velocity trends in different times.
We only discuss the 30-year changes in body proportion using weight for height from 1985 to 2015 due to lack of related data in 1975.
Introduction
Secular trend of physical growth is an important phenomenon 1 which could provide data about the evolution of the human physique and indirectly reflect changes in social environment, as well as could reveal the potential problems of children’s nutrition and health at the population level and provide more reference for clinical diagnosis and treatment.
Data from the past 100 years that span the industrial revolution and rapid socioeconomic development indicate that populations in western developed countries had increased in height, especially in the early stage of rapid social development. This reflects the positive effect of environmental improvement on human growth, which was also considered to be the main cause of the trends.2 However, the increasing trend had slowed down or even stagnated despite further social development after the 1990s in some developed countries,3–7 and it was evident that population height had gradually reached the maximum genetic potential. On the other hand, many reports from developing countries still showed a rapidly increasing trend.8–11 Therefore, it was necessary to obtain more data in different countries and at various times to fully understand population-level trends and racial differences in growth.
With the high prevalence of obesity and the trajectory phenomenon of obesity from children to adults, overweight and obesity in early childhood attract global attention.12 Early prevention of obesity at the population level has become the most important public health strategy.13 Analysing the secular changes in the whole distribution of weight and weight for height, especially changes in the upper and lower ends of the distribution of growth in the population, will help to fully understand the status of weight in the population and provide more important clues to find potential nutritional problems. This will ultimately help policy makers consider and decide strategies and interventions. However, many studies on growth changes concentrate on the average level in the population till now; there is little research on the changes in the distribution of physical growth indicators.
In China, the first large-scale national survey on growth, named ‘The National Survey on the Physical Growth and Development of Children in the Nine Cities of China’ (NSPGDC), was carried out in 1975.14 Then it was conducted again in 1985,15 1995,16 200517 and 201518 using the same methods at the same sites. The NSPGDC I–IV data had illustrated a significantly increasing trend.19 To understand whether the increasing trend continues and how the distributions of height and weight change, we used the NSPGDC I–V data to analyse the latest 40-year trends in growth of children under 7 years in developed regions of China.
Methods
Study design and setting
Five large-scale cross-sectional surveys were conducted across nine cities during June–October in 1975, 1985, 1995, 2005 and 2015, which were respectively named the NSPGDC I–V. The nine cities were Beijing (Municipality), Harbin (Heilongjiang’s provincial capital), Xi’an (Shanxi’s provincial capital), Shanghai (Municipality), Nanjing (Jiangsu’s provincial capital), Wuhan (Hubei’s provincial capital), Guangzhou (Guangdong’s provincial capital), Fuzhou (Fujian’s provincial capital) and Kunming (Yunnan’s provincial capital). All surveyed sites were nearly the same in NSPGDC I–V.
Participants
Healthy children under 7 years were included in the five surveys and their exclusion criteria were the same: non-local residents who lived in the region for less than two-thirds of their lifetime, gestational age at birth <37 weeks or birth weight <2.5 kg, twins or multiple births, participants suffering from chronic systemic disease, congenital diseases, endocrine diseases, diseases of the nervous system, and those with fever for more than 7 days in the past 2 weeks or continuous diarrhoea more than five times every day for 5 days or longer.14–18
A multistage stratified cluster sampling method was used. Some administrative districts located in the urban or suburban areas of each city were selected. The hospitals, communities and kindergartens in each selected administrative district were considered as the cluster sample unit to respectively collect newborns, children aged 1 month to 3 years, and children over 3 years (including 3 years). All children included in the five surveys were involved. Because urban areas represent the better socioeconomic environment of each city, they were selected to illustrate the growth trends in developed regions of China in this paper.
All children were divided into 22 age groups: birth (0–3 days), 1 month-, 2 months-, 3 months-, 4 months-, 5 months-, 6 months-, 8 months-, 10 months-, 12 months-, 15 months-, 18 months-, 21 months-, 2 years-, 2.5 years-, 3 years-, 3.5 years-, 4 years-, 4.5 years-, 5 years-, 5.5 years- and 6–7 years. For example, the 1month- group included chlildren aged from 1month to 1day less than 2 months, 2years- group included children aged from 2years to 1 day less than 2years and 6months, and so forth.
Data collection and quality control
Weight and height/length were measured by trained investigators using standardised methods in the five surveys.14–18 Weight was obtained by newborn scales (accurate to 10 g) for newborns, and lever scales (accurate to 50 g, in 1975–2005) or electronic scales (accurate to 50 g, in 2015) for children aged 1 month or older. Length was measured using an infantometer (accurate to 0.1 cm) for children under 3 years and height was measured using Height-Sittingheight Stadiometer (accurate to 0.1 cm) for children aged 3 years or older in the five surveys.
Measuring equipment at all the sites was uniform, and calibrated daily using standard weights for the weight scale (error less than 50 g) and 2 m steel rulers for the infantometer and Height-Sittingheight Stadiometer. All the investigators had participated in rigorous specialised training and passed an examination prior to the investigation. Measurement errors were no more than 50 g in weight or 0.5 cm in height within intraobserver and interobserver measurements. Five per cent of the total subjects in each site were repeat measured randomly per day, and the proportion of subjects beyond allowable errors was less than 10%.
Ethical considerations
Since the study is a secondary data analysis of the NSPGDC I–V and all results are published on a group level and no individuals can be identified, ethical approvals are not required.
Statistical methods
SPSS V.20.0 for Windows was used to analyse the data. The mean weight and height were described by x±SD and the third, fiftieth and ninety-seventh centiles were calculated to describe their distributions. Total crude increments, per-decade crude increments and the relative increments (calculated by the formula  ) of weight and height were calculated from 1975 to 2015. Weight for age Z-scores (WAZ) and height for age Z-scores (HAZ) were calculated based on the WHO Child Growth Standards (2006) for children under 60 months and the WHO child growth reference (2007) for children aged 60–83 months by the LMS method. Because we measured the length for children aged 24–35 months, it was transformed into height by reducing 0.7 cm in length and HAZ was calculated. Weight for height was used to evaluate the body proportion of the children and only 30-year changes from 1985 to 2015 were analysed due to the scarcity of data in 1975 and their weight for height Z-scores (WFHZ) was also calculated based on the WHO Child Growth Standards (2006) by the LMS method. Independent samples t-tests were used to compare the differences between two neighbouring surveys. The annual increments of weight and height from birth to 6 years were also calculated to roughly reflect the growth velocity; then we compared their changes from 1975 to 2015 to understand the changes in growth velocity. A value of p<0.05 was considered statistically significant.
Patient and public involvement
This study is a secondary data analysis of NSPGDC and patients or public are not involved in the development of the research question, design, and conduct of the study or dissemination of results.
Results
Summary of participants
The sample sizes were 94 496 in 1975, 79 177 in 1985, 79 152 in 1995, 69 760 in 2005 and 83 583 in 2015. Table 1 shows the sex–age subgroup sample size.
Sample size of The National Survey on the Physical Growth and Development of Children in the Nine Cities of China (NSPGDC) I–V (1975–2015)
Changes in mean weight, height and weight for height
A significant increasing trend in weight and height was observed during the lasted 40 years in the nine cities. The average crude increments of boys were 1.41 kg in weight and 3.5 cm in height/length, and those of girls were 1.24 kg in weight and 3.3 cm in height/length. Table 2 illustrates that the crude increments became larger with age.
Means of weight and height and the crude increments from 1975 to 2015
Figure 1 displays the relative increments of weight and height from 1975 to 2015: weight relatively increased by 3%–8% in children under 1 year and 8%–23% in children older than 1 year, which as was significantly larger than that of height (1%–3% in children under 1 year, and 3%–6% in children older than 1 year). When stratified by gender, we found that the relative increments of height at age 0–7 years and of weight at age 0–4 years were similar in boys and girls, but the relative increments of weight at 4–7 years were larger in boys.

The relative increments of mean weight and height/length from 1975 to 2015. m, months; y, years.
Table 3 shows that weight for height had increased from 1985 to 2015 and the increments became larger after 100 cm, especially in boys.
Mean weight for height and its increments from 1985 to 2015
Changes in the distribution of weight, height and weight for height
Figure 2 illustrates that the third, fiftieth and ninety-seventh centiles of weight or height had significantly increased during 40 years, with unbalanced increments in the three centiles. For weight, the crude increments in the three centiles in children under 2 years were similar, while in children older than 2 years, the crude increments in the ninety-seventh centile were significantly larger than those in the third and fiftieth centiles. For example, the crude increments in the third, fiftieth and ninety-seventh centiles in boys aged 5.5 years are 2.26 kg, 3.56 kg and 8.44 kg, respectively. Furthermore, we found that the relative increments in the third centile in children under 2 years of age were slightly larger than those in the fiftieth and ninety-seventh centiles. For example, the third, fiftieth and ninety-seventh centiles in 6-month-old boys relatively increased by 6.4%, 5.5% and 3.7%, respectively. But a larger relative increment in the ninety-seventh centile was observed in children older than 2 years. For example, the third, fiftieth and ninety-seventh centiles in boys aged 5.5 years relatively increased by 15.8%, 20.3% and 39.0%, respectively. For height, the crude and relative increments in the third centile were slightly larger than those in the fiftieth and ninety-seventh centiles. For example, the third, fiftieth and ninety-seventh centiles increased 2.3 cm, 1.3 cm, 0.7 cm in 6-month-old boys (relatively increased by 3.6%, 1.9%, 1.0%) and 5.5 cm, 5.1 cm, 4.6 cm in boys aged 2.5 years (relatively increased by 6.6%, 5.6%, 4.7%).

Changes in the third, fiftieth and ninety-seventh centiles of weight and height/length from 1975 to 2015 (the lines were respectively the third, fiftieth and ninety-seventh centiles from the bottom upwards in 1975 and 2015).
Figure 3 shows that the third, fiftieth and ninety-seventh centiles of weight for height increased from 1985 to 2015, and the increments in the three centiles were similar for heights shorter than 100 cm, while the increments in the ninety-seventh centile were significantly larger than those in the third and fiftieth centiles for heights taller than 100 cm. For example, the crude increments in the third, fiftieth and ninety-seventh centiles were 0.37 kg, 0.37 kg, 0.43 kg at 60 cm (relatively increased by 7.7%, 6.3%, 6.1%) and 1.13 kg, 1.38 kg, 3.29 kg at 110 cm (relatively increased by 7.5%, 8.0%, 16.2%) in boys.

Changes in the third, fiftieth and ninety-seventh centiles of weight for height from 1985 to 2015 (the lines were respectively the third, fiftieth and ninety-seventh centiles from bottom upwards in 1985 and 2015).
Changes during 40 years in annual increments of weight and height from birth to 6 years
Table 4 displays the annual increments of weight and height from birth to 6 years during 1975–2015. The annual increments were more significant between birth and 2 years for height and between ages 4 years and 6 years for weight.
Annual increments of weight and height/length from birth to 6 years, 1975–2015
Per-decade changes in the mean weight, height and weight for height
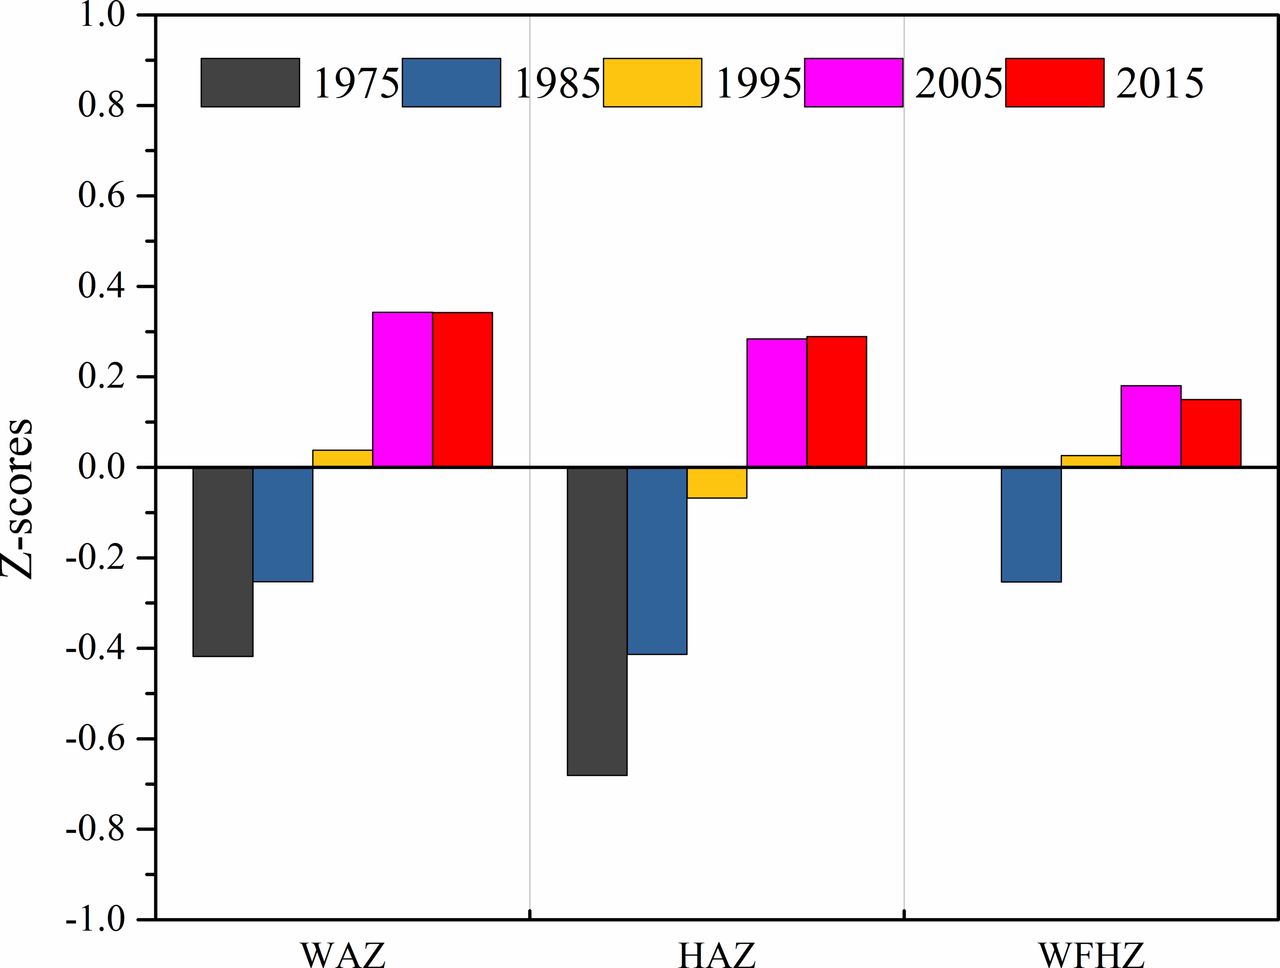
The weight, height and weight for height were standardised using the WHO Child Growth Standards to summarise the trends of each decade during the 40 years. Figure 4 illustrates that WAZ and HAZ rapidly increased during the first three decades, while their increasing trends were not significant during the fourth decade and their increments in 1975–1985, 1985–1995, 1995–2005 and 2005–2015 were, respectively, 0.17, 0.29, 0.31, 0.00 in WAZ and 0.27, 0.35, 0.35, 0.00 in HAZ. We found that WFHZ had increased during 1985–2005, but slightly decreased during 2005–2015. The increments of WFHZ were 0.28 in 1985–1995, 0.15 in 1995–2005 and −0.03 in 2005–2015. The per-decade crude increments of mean weight and height from 1975 to 2015 are shown in table 5 and that of mean weight for height from 1985 to 2015 are shown in table 6.
Comparison of per-decade increments in mean weight and height (1975–1985, 1985–1995, 1995–2005 and 2005–2015)
Comparison of per-decade increments in mean weight for height (1985–1995, 1995–2005 and 2005–2015)

The Z-score of weight, height and weight for height based on WHO Child Growth Standards from 1975 to 2015. HAZ, height for age Z-score; WAS, weight for age Z-score; WFHZ, weight for height Z-score.
Discussion
Our study displays a rapidly increasing trend in the physical growth of children under 7 years in nine cities during 1975–2015. The trend may be associated with the rapid socioeconomic development in China: first, the per capita gross domestic product of nine provinces, whose capitals were the nine cities we selected, increased from ¥562 in 1975 to ¥62 971 in 2014, and their household disposable income increased from ¥351 in 1975 to ¥32 301 in 2014. Second, national statistical data illustrate that medical and healthcare services improved, such that the number of doctors per 10 000 people increased from 10 in 1975 to 22 in 2015, the infant mortality rate changed from 62.6‰ in 1975 to 8.1‰ in 2015, the mortality rate of children under 5 years decreased from 85.2‰ in 1975 to 10.7‰ in 2015, and the newborn mortality rate decreased from 33.1‰ in 1991 to 5.4‰ in 2015. Third, the data of Chinese Nutrition and Health Surveillance, which started in 1982 and the latest survey was in 2012, indicates that the nutritional intake of the Chinese population had significantly improved; for example, the daily intake of milk, egg, fish and shrimps, and meat were respectively 9.9 g, 15.5 g, 21.6 g and 62.0 g in 1982, which increased to 37.8 g, 29.5 g, 32.4 g and 98.5 g in 2012. It is suggested that the comprehensive socioeconomic, medical and healthcare improvement, as well as food supply provided a favourable environment for the growth of children.2 6 20 21
The extent of secular growth changes is influenced by many factors. In this paper, we found that the average height and weight of children under 7 years increased 3.3–3.5 cm and 1.2–1.4 kg, respectively, during the last 40 years, and the crude increments also increased with age, which reached 6–7 cm in the 6 years group (1.5–1.8 cm/decade). The increments in height were slightly more than in those of some countries: the increments of height were 1–2 cm in Dutch children aged 1–4 years during 1955–2009 (50 years),7 1–3 cm in South Asian children aged 2-6 years living in the Netherlands during about 40 years (1976–2010),22 2.7–3.3 cm in Czech children aged 2.5 years during 50 years (1951–2001),23 0.9–1.1 cm in Turkish children aged 5 years during 30 years (1975–2008)24 and 1.1–1.5 cm in Canadian children aged 6 years per decade during 1891–1974.25 In Japan, data from 1950 to 2000 illustrate that the height increments in children aged 6 years were 1.6 cm/decade,6 which were similar to our results. Furthermore, the height increments in boys and girls aged 6 years in South Korea during 1965–2005 (10.3 cm, 11.7 cm) were higher than our results (7.1 cm, 6.3 cm). Therefore, we found the height increments in Chinese, Japanese and South Korean children were higher than in those of other countries, which could be related with the social and economic backwardness or even retrogression during World War II and then the rapid social development after World War II. The rapid increase in height may indicate the integrated results of catching up and a positive secular trend in physical growth.26
Inequality in the proportion of increments of weight and height could predict the changes in body proportion. Our results show that the relative increments of weight were significantly larger than those of height, which illustrates that the body proportions of Chinese children changed from slender to thickset over the last 40 years. The positive changes in weight for height from 1985 to 2015 also established that weights of children in 2015 were 0.16–2.53 kg greater than those in 1985 for a given height. The changes in the distribution of weight and weight for height had shown an upward shift. In younger children (under 2 years), the increments in the third, fiftieth and ninety-seventh centiles were similar, even slightly higher in the third centile, which suggests that the nutritional status of all infants and young children had improved, especially the low-growth-level infants and young children in the population. However, in older children (older than 2 years or taller than 100 cm), the relative increments in the ninety-seventh centile of weight and weight for height were significantly larger than those in the third and fiftieth centiles, which indicated that the upward shift in weight and weight for height was more prominent in the upper ends of the distribution. The results predict that overweight or obesity might become a potential health problem as children's nutrition improves among older children. This is consistent with the fact that obesity in Chinese children has become more common since the 1980s: the prevalence of obesity was from 0.91% in 1986 to 3.44% in 2006 for preschool children27 and from 1.0% in 1985 to 17.8% in 2010 for school-age boys in large cities.28 Global data illustrate that childhood obesity has increased dramatically and has become a very important health problem for children and adults.12 29 Therefore, timely monitoring of the trends in the distribution of weight and weight for height at the population level would be more helpful for the projection of the obesity epidemic as early as possible and provide more data for designing effective public health strategies. Moreover, these results also suggest that if we do not consider the pronounced upward shift in the upper centiles when updating the weight or weight for height reference, the upper ends of the reference will significantly rise, which will be more unfavourable for the prevention of obesity and other related health problems.
The height has shifted upwards in all the centiles in our results. The increase in the low centile would be an important manifestation of the improvement of children's nutrition. The changes in the high centiles of height indicate that linear growth has not reached the maximum genetic potential and will gradually be fully exploited with the environment improving. Compared with the relative increments among all centiles, we found the increments in the low centiles were larger than in the other centiles, especially in children under 3 years. This indicates that the improvement of linear growth was more significant in vulnerable children when the environment improved.
Physical growth velocity of children under 7 years was roughly approximated by calculating annual increments of corresponding age using data from these series of cross-sectional surveys. It demonstrates that the annual increments of height and weight during the first year of life were similar to the WHO longitudinal growth velocity in 2009 (25.8 cm, 6.27 kg in boys and 24.7 cm, 6.14 kg in girls),30 which suggests that the annual increments from large-scale cross-sectional surveys could roughly reflect the growth velocity. Therefore, we calculated the annual increments of height and weight in NSPGDC I–V in order to analyse the secular changes of growth velocity. These results indicate that the growth velocity of height during the first 2 years after birth had increased more significantly than in other ages, which may be related to the improved feeding pattern of children under 2 years.31 It is also suggested that the linear growth of infants would be more sensitive to environmental improvement, and environmental intervention in infancy may be more effective to improve their linear growth, which is consistent with Cole’s research reports.32 From the changes of weight growth velocity, we found that the increments of weight growth velocity in children over 4 years were more obvious, which indicates that age 4 years and above should be considered as the key window period for early obesity intervention.
From the per-decade increment, we found the rapid increasing trend had not continued and the increments of the fourth decade (2005–2015) in weight, height and weight for height had slowed down or even stagnated when comparing with the previous three decades. The secular growth trend of children under 7 years in developed regions of China was consistent with that of other developed countries.4 6 7 33 The trends of height may be associated to the population genetic potential of height; the height of the population will gradually reach the maximum genetic potential after rapidly increasing under the background of social and economic sustainable development in the developed regions of China. Meanwhile, the slight deceleration of the increasing trend in weight or weight for height may be related to the focus on overweight and obesity in children and the spreading of healthy promotion strategies among the population in the past years, especially the last 10 years.
There were some limitations of our study. First, the annual increments of physical growth calculated by the data from the five cross-sectional surveys were used to describe the changes of growth velocity. We compared these data with the growth velocity of WHO and found that they were similar. Therefore, we thought these results might roughly illustrate the trends in growth velocity in different periods and provide some data for comprehensively understanding the secular trends in physical growth in developed regions of China. Second, we could not obtain data of body proportion in 1975, thus we could only analyse the changes in body proportion by weight for height from 1985 to 2015.
Acknowledgments
The authors thank the National Health and Family Planning Commission of the People’s Republic of China and the nine provinces and cities Health and Family Planning Commission for their support and organization in the process of starting and implementing the project. The authors also thank all investigators for their excellent fieldwork, especially with their careful measurements. The authors also thank all the children and their parents involved in the survey for their support and participation.
References
Footnotes
Contributors Ya Qin Zhang contributed to data analysis, preparation and writing of the initial draft of the manuscript. Hui Li designed the study, directed the data analysis and modified the manuscript. Hua Hong Wu inputted and cleared up the data. Xin Nan Zong contributed to data analysis. All authors read, critically reviewed and approved the final manuscript as submitted.
Funding The study was supported by the National Health and Family Planning Commission of the People’s Republic of China and Beingmate Women and Children Development Research Foundation.
Competing interests None declared.
Patient consent for publication Not required.
Provenance and peer review Not commissioned; externally peer reviewed.
Data availability statement No data are available.