Article Text

Abstract
Introduction Antimicrobial resistance (AMR) is a major threat in sub-Saharan Africa (SSA), but assessments of antimicrobial consumption (AMC) are limited. This study aimed to investigate regional AMC and resistance patterns in a representative area of Tanzania and to introduce a method for determining AMC in low-resource settings.
Design and methods We conducted a retrospective study using prescription data collected over 5 years (2013–2017) from multiple hospitals and selected primary health facilities in the Dodoma Region of Tanzania. The study employed the WHO’s Anatomical Therapeutic Chemical (ATC) classification and Daily Defined Dose (DDD) methodology to quantify antimicrobial use. Outpatient prescription records that met our inclusion criteria were analysed, while incomplete records were excluded. Sensitivity testing for frequently prescribed antimicrobials was performed against representative gram-negative and gram-positive bacteria, with resistance expressed as minimum inhibitory concentrations and resistance percentages.
Setting and participants This study was conducted across several high-volume healthcare facilities in the Dodoma Region, encompassing both hospital and primary care settings. The dataset comprises outpatient prescription records from these facilities, representing a significant proportion of the regional healthcare usage. The selected facilities were chosen based on their substantial catchment populations to maximise data volume and relevance.
Outcome measures The primary outcome measure was the DDD per 1000 inhabitants per day (DID) for various antimicrobial classes. Secondary outcomes included the prevalence of specific drugs, such as amoxicillin and erythromycin, and their corresponding resistance profiles. Resistance data were quantitatively analysed, with particular attention given to penicillinase-sensitive penicillins and their resistance rates among gram-negative and Gram-positive bacteria.
Results Analysis revealed that single penicillins, particularly amoxicillin, dominated prescriptions, accounting for 25% to 60% of hospitals and 13% to 29% of primary health centres. Erythromycin was prescribed in 9.4% to 25.1% of cases across facilities. The overall AMC in the region ranged from 36.7 to 50.2 DID during the study period, with consumption patterns showing an initial increase of 4.3% from 2013 to 2014, a subsequent 29.0% decrease from 2014 to 2015, followed by a 34.1% increase from 2015 to 2016 and a further 37.9% increase from 2016 to 2017. Resistance testing demonstrated that penicillinase-sensitive penicillins exhibited an average resistance rate of 87.3%, with gram-negative and gram-positive bacteria showing resistance levels of 90.1% (±8%) and 83.6% (±8%), respectively, indicating a statistically significant association (p<0.05) between high consumption and elevated resistance.
Conclusion Our findings reveal that AMC in the Dodoma Region is high and is linked to significant resistance against commonly used agents. This study presents a robust method for monitoring AMC and resistance in a resource-efficient manner, offering potential applicability in similar settings across SSA. The data, though representing only a fraction of total antimicrobial use, underscore the urgent need for targeted antimicrobial stewardship interventions, particularly at the primary healthcare level. Future research should further investigate demographic influences and evaluate intervention strategies to mitigate AMR effectively.
- Hospitals
- Antibiotics
- Infection control
- PUBLIC HEALTH
Data availability statement
Data are available upon reasonable request. Raw data will be shared upon request from the corresponding author.
This is an open access article distributed in accordance with the Creative Commons Attribution Non Commercial (CC BY-NC 4.0) license, which permits others to distribute, remix, adapt, build upon this work non-commercially, and license their derivative works on different terms, provided the original work is properly cited, appropriate credit is given, any changes made indicated, and the use is non-commercial. See: http://creativecommons.org/licenses/by-nc/4.0/.
Statistics from Altmetric.com
STRENGTHS AND LIMITATIONS OF THIS STUDY
The study relies on stock records, drug registry files and patient prescriptions, which may not fully capture the actual antimicrobial consumption patterns.
Antimicrobial sensitivity data were sourced from only one hospital laboratory, limiting the generalisability of resistance patterns.
The study did not examine the appropriateness of prescribing practices or reasons for antibiotic use and focused on high-volume facilities, potentially overlooking trends in smaller health centres.
The exclusion of over-the-counter sales suggests that the reported antibiotic consumption values are likely conservative estimates of true community-wide use.
Introduction
Infectious diseases, including bacterial infections, continue to be a significant cause of morbidity and mortality globally; antimicrobial resistance (AMR) has further made them fatal. The discovery of penicillin in 1928 and its resulting production and introduction as the main option for treating infectious diseases resulted in the antibiotic boom and control of bacterial-related infections.1 However, globally, the ability to treat common infectious diseases is still threatened by AMR. As, of 2019 according to the Centre for Disease Control annual statistics in the USA, approximately 2.8 million people acquire infections that are resistant to antibiotics, and over 35 000 people die as a result2 with projection indicating escalation to approximately 10 million deaths annually by 2050 if inadequate measures are implemented.3 The cost implications due to AMR have been estimated to translate to US$20 billion in excess direct healthcare costs, with additional costs to society for lost productivity as high as US$35 billion annually.4 AMR is a growing global health crisis, with particularly severe consequences in sub-Saharan Africa (SSA). In 2019, SSA had the highest mortality rate of approximately 23.5 deaths per 100 000 attributed to AMR compared with other regions.5 Inappropriate and excessive use of antimicrobials has been identified as a key driver of AMR, contributing to increased morbidity, mortality and healthcare costs.1 2 Limited access to quality healthcare and widespread misuse of antimicrobials have supercharged the rapid spread of AMR across SSA. Therefore, strategies are required to strengthen antimicrobial stewardship and improve infection prevention and management of misuse of antimicrobials to combat this growing threat to public health and economic prosperity in SSA.
The overuse and misuse of antimicrobials is a key driver of AMR globally. Global antibiotic consumption has been reported to increase by 39% per capita from 2000 to 2015 with high-income countries consuming more antibiotics at higher rates6 compared with low-income earners. There has been increasing evidence that antibiotic-resistant regions have an increased antibiotic consumption rate.7 Such patterns of inappropriate antimicrobial use have contributed to AMR. Antimicrobial consumption (AMC) data are crucial for understanding and addressing the AMR challenge, as it allows the monitoring of consumption patterns, identifies targets for stewardship and evaluates the impact of interventions. The challenge in low-income and middle-income countries (LMICs) has been devising methods of developing quantifying AMR. As a result, the 68th World Health Assembly held in May 2015 adopted a global action plan on combating AMR. The global action plan encompassed certain objectives such as creating awareness, effecting surveillance and research and optimising the use of antimicrobial medicines.7 To monitor antimicrobial use, the WHO also adopted the Anatomical Therapeutic Chemical/Defined Daily Dose (ATC/DDD) methodology.8 The WHO’s ATC classification system and Defined Daily Dose (DDD) methodology provide a standardised framework for quantifying AMC, enabling comparisons across settings and over time.9 However, comprehensive AMC data remain limited in many sub-Saharan African countries, including Tanzania.
Various AMR surveillance modalities have been described by the WHO; however, collecting and analysing antimicrobial susceptibility patterns from hospital microbiology laboratory data provides critical insights into resistant strains circulating in healthcare settings and the effectiveness of various antimicrobial agents.10 Aggregating susceptibility data at the regional or national level further enhances surveillance efforts, allowing the detection of outbreaks, circulating resistant pathogens, allocating resources and developing evidence-based policies to combat AMR.11 In LMICs and high-income settings, microbiology testing is often performed as part of the standard of care; thus, passive AMR surveillance is being performed using this routine microbiology.12 However, the quality and comparability of this surveillance data depend on standardised laboratory methods, reporting and data management systems. Thus, optimising existing tools for diagnosing bacterial infections and generating bacterial identification and antimicrobial susceptibility data on-site is the foundation of an AMR surveillance system.
There is a need for comprehensive AMR surveillance that requires the integration of several strategies for complementary data streams, which can provide a robust, evidence-based system for combating AMR.13 AMC studies in the region have been reported by researchers such as Camara et al who carried out a literature review on AMR consumption studies in Tanzania between January 2012 and March 2021,14 while Mabilika et al explored the prevalence and predictors of antibiotic prescriptions in primary healthcare facilities.15 Mabilika and his team concluded that high rates of antibiotic prescriptions, poor adherence to standard treatment guidelines and high levels of antibiotic prescribing practices were attributed to the level of education of the prescribers. The study did not tackle AMC. Mbwasi et al carried out a comprehensive study of national AMC based on data from imported antibiotics from the Tanzania Medicines and Medical Devices Authority (TMDA) and local manufacturers.16 However, this is upstream data that does not translate to patients’ consumption. Therefore, in this study, we report for the first time the quantification of AMC to determine the utilisation patterns based on the downstream data in the antimicrobial value chain. The study further explores the sensitivity patterns of various prescribed antimicrobial agents against gram-negative and gram-positive bacteria. Combining the AMC data with antimicrobial susceptibility patterns will provide a complete picture of the drivers and impact of resistance and identify the resistance profiles of circulating pathogens. We envisage that health authorities can identify high-risk prescribing practices, detect emerging resistance trends and evaluate the effectiveness of stewardship interventions. The current study aimed to conduct AMC analysis using the WHO ATC and Daily Defined Dose (DDD) methodology and link the consumption data to sensitivity testing. Such studies have, so far, not been reported in Tanzania and the region at large. We expect the results of this study to provide information to improve AMR stewardship. The findings provide critical insights into antimicrobial use patterns and can inform the development of targeted antimicrobial stewardship programmes to combat the growing threat of AMR in the region and other low-resource settings.
Methods
Study design
A mixed study design was employed, by using a retrospective analysis for consumption data of antimicrobials in hospitals and selected primary health facilities (ie, health centres) in Dodoma Region, Tanzania, from 2013 to 2017 and a prospective cross-sectional study for conducting antimicrobial susceptibility tests. The study was conducted after acquiring an ethical clearance from the Internal Ethical Review Committee of St John’s University of Tanzania (SJUT/IRB/051518) issued on 15 May 2018. The methods were performed in accordance with the relevant guidelines and regulations. Personal information from the patients’ prescriptions was not recorded, and all data were anonymised to ensure patient confidentiality. Health centres were selected based on the highest volume of outpatient attendance per year (≥15 000). The study did not involve human participants or have access to patient information. Instead, data on antibiotic consumption were collected by accessing patient prescriptions. The collected data were then analysed following the WHO ATC and DDD methodology, using the AMC tool developed by the WHO Collaborating Centre for Drugs Statistics.17 18 Data on the annual consumption of antimicrobials were collected across selected antimicrobial classes, substances, types of formulation and by health facility category. In addition, retrospective antimicrobial sensitivity data were collected from the Dodoma Regional Referral Hospital (DRRH) central laboratory. The following health facilities in the Dodoma Region were included: (1) the DRRH, (2) all district hospitals and (3) any two health centres in a district with high attendance rates. Private health facilities in the Dodoma Region and public primary health facilities with low outpatient attendance were excluded from the study.
Patient and public involvement
Patients and/or the public were not involved in the design, conduct, reporting, or dissemination plans of this research.
Measures
The primary measure of interest was the consumption of antimicrobials by year across selected antimicrobial classes, substances, type of formulation and by health facility category. The second measure of interest was the regional AMR profile concerning the commonly used antimicrobials. To obtain those measures, the extent of the current AMC patterns was determined in DDD per 1000 inhabitants per day (DID) and the percentage consumption in DDD per antibacterial group compared with other products in each group of antimicrobials. The population served was defined as the total annual attendance of outpatients at a facility, at the district or regional level. AMC data were collected from January to December for each year from 2013 to 2017 from a sample of health facilities in the Dodoma Region, and antimicrobial sensitivity test result patterns were identified from the DRRH laboratory to link AMC results with AMR profile. To measure the AMC at the facility, district and regional level, the DDDs were calculated as provided by the WHO tool and methodology on AMC.17 18
To present consumption data, quality indicators17 18 were adopted as follows: (a) total consumption of antimicrobials in DDD/1000/attendance/per day for system use (ATC group J01) and subgroups (the only antimicrobials included in the study were oral antifungals and metronidazole) and (b) comparative consumption of different antimicrobial formulations, that is, parenteral and oral (capsules/tablets and syrups/suspensions) were calculated using this formula, which can be expressed as an equation19:

where prescriptions refer to the number of prescriptions generated or dispensed (N), mass is the dose in grams (M), quantity refers to the pack size (Q), DDD is the figure assigned in the WHO guidelines and population is the sample size reflected (P); the calculation is multiplied by 1000 to convert the population size to ‘per 1000 population’. Time is the number of days of the study duration (365 days).

Tools for data collection
An Excel tool (online supplementary material 1) was developed to collect monthly data on antimicrobial prescriptions for outpatients from the chosen health facilities (from January to December) of each year from 2013 to 2017. Data collectors used the same tool to fill in the average annual outpatient attendance of a given facility for each year. The data were arranged according to year, type of antimicrobial, ATC code, route (ie, oral or parenteral), total quantity, strength and dosage form. The DDD values were calculated following the WHO-AMC tool 2015 V.1.5.18 The TMDA’s registration list was used as a reference to obtain generic names for medicines prescribed in brand names. Those were employed to get the ATC number and DDD for each product compiled from the WHO database.20
Supplemental material
Data collection
The retrospective data collection occurred in all eight Dodoma Region councils. Data from councils were collected from 21 June to 2 July 2018. According to the 2012 Tanzania National Census, the Dodoma Region had a total population of 2 083 588. This retrospective AMC surveillance study at the health facility level focused on several key healthcare facilities within the region:
DRRH
Three district hospitals:
Mpwapwa District Hospital (MDH)
Kondoa District Hospital (KoDH)
Kongwa District Hospital (KDH)
Eleven health centres:
Chamwino (CHA), Bahi (BAH), Mpyayungu (MPY), Menenia (MEN), Busi, Hamai (HAM), Kwamtoro (KWA), Makole, Hombolo, Mdemu, and Kondoa Town Council. The study employed a systematic sampling approach for prescription data collection, with thresholds set as follows: as an inclusion criterion for the facilities selected:
Regional referral hospital: 1200 prescriptions per year (100/month)
District hospitals: 600 prescriptions per year (50/month) each
Health centres: 300 prescriptions per year (25/month) each
This sampling strategy ensured a comprehensive representation of antimicrobial prescribing patterns across different levels of healthcare facilities in the Dodoma Region. Based on the 2012 census, the population distribution across the districts involved was as follows:
Mpwapwa District: 305 056
Kondoa District: 269 704
Kongwa District: 309 973
CHA District: 330 543
BAH District: 221 645
This network of hospitals and health centres covers a significant portion of the Dodoma Region’s population, providing a representative sample for the study of AMC patterns in both urban and rural settings of central Tanzania. Retrospective AMC data were collected from prescriptions, the Health Management Information System (HMIS) (MTUHA) and register books21 22 for outpatients and inpatients stored at the facilities. The data collectors visited the facility to gather information from the HMIS (Mfumo wa Taarifa za Uendeshaji Huduma za Afya (MTUHA)) and register books. However, data from dispensing registers were excluded due to poor recording practices. The selection of prescription drugs was based on the frequency of commonly prescribed antimicrobials. Additionally, the total number of outpatient attendances per year was collected at each facility.15 16 23–27
Data management
The data were initially extracted from the records and then digitised for analysis. Data cleaning procedures were applied to remove duplicates, correct errors and standardise variable formats. The cleaned data were subsequently aggregated to calculate key metrics for DID calculation. Quality control measures were implemented using data quality checks throughout the process, and cross-validation between different data sources was conducted to ensure consistency and accuracy. Finally, the consolidated dataset was stored in a secure database and used for further statistical analysis to evaluate AMC patterns and their correlation with AMR trends.
Calculation of measures
The DDD is calculated by taking the total weight of the antibiotics consumed in grams divided by the WHO assigned DDD value of the antibiotic. The DDD value is the average maintenance dose for an adult weighing 70 kg. The total value of medicine, in grams, is determined by aggregating the amount of each active ingredient across the various formulations (eg, different strengths of tablets, capsules, syrups and injections) and quantities dispensed. The DDD provides a measure of the extent of use. However, for comparative purposes, these data are usually adjusted for population size served or population group; this depends on the medicines of interest and level of data disaggregation.28 29
In this study, the DDD/1000/day for antimicrobials was calculated using the total annual outpatient attendances served by the individual hospitals or health centres (DID). The total number of days of service was the whole year, 365 days. For the calculation of district DID, all attendances from the studied health facilities in the districts were added up to get the district total. The district totals were added to calculate regional DID.
Informed consent
Due to the retrospective nature of the study, the Internal Ethical Review Committee of St John’s University of Tanzania (number: SJUT/IRB/051518) waived the need to obtain informed consent.
Antimicrobial sensitivity
To gain insight into the link between consumption and sensitivity, we collected antimicrobial culture sensitivity patterns (disk diffusion method) from the DRRH laboratory from 2013 to 2017.30 A total of 139, 402, 455, 418 and 991 blood and urine samples were evaluated for antimicrobial culture sensitivity against various gram-positive and gram-negative bacteria for each year from 2013 to 2017. DRRH has a programme of periodic sensitivity testing of commonly prescribed antibiotics using the disc diffusion method on the most prevalent bacteria. The samples used were blood and urine. The bacterial strains used in the study included Escherichia coli, Klebsiella spp, Proteus spp, Pseudomonas aeruginosa, Salmonella spp and Staphylococcus aureus. These strains were selected to evaluate their resistance against the most prescribed antibiotics.
Results
Consumption of selected antimicrobial subclasses at the hospital level
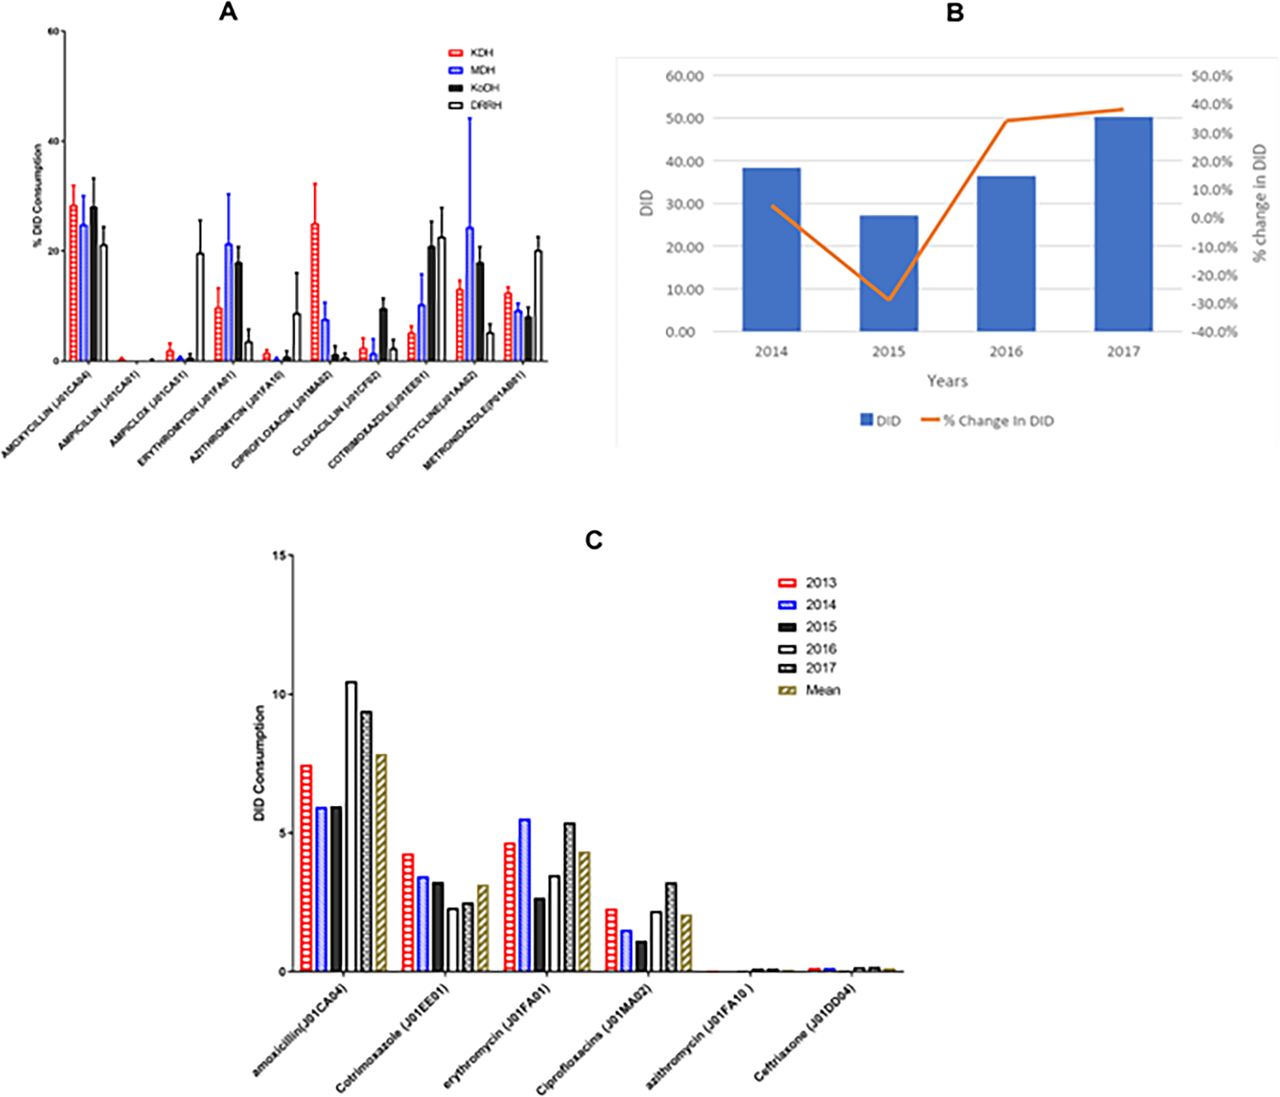
Comparing the consumption of some selected subclasses of antibacterials showed no significant difference between the district hospitals and the regional referral hospital regarding commonly prescribed antimicrobials within the selected subclasses. All hospitals commonly prescribed amoxicillin, the chosen indicator drug for single penicillins, at a high consumption rate at the DRRH (60.6%) followed by the KoDH (40.0%), MDH (32.8%) and KDH (25.1%). District hospitals rarely used penicillin combination products (ie, Ampiclox); however, it was commonly prescribed at the DRRH with a consumption of 35.7%. There was generally low consumption of combination products at district hospitals. However, MDH had slightly a higher consumption of macrolides (17.7%) than the other two district hospitals (each 9.5%). Consumption of fluoroquinolones at the DRRH (12.8%) was higher than in district hospitals (10% at KDH, 5.7% at MDH and 2.7% at KoDH). Cotrimoxazole, a combination sulphonamide, was commonly prescribed at the KDH (17.9 %) and MDH (12.4%), but at a low utilisation at the DRRH (3.2 %) and negligible prescribing level at KoDH. Fluconazole, an oral antifungal, was commonly prescribed by all hospitals with the DRRH leading (36.4%), followed by MDH (23.9%), KoDH (20.0%) and KDH (15.8%) (figure 1).

Overall average 5 year consumption of selected subclasses of antimicrobials in DID percentages in district hospitals. DRRH, Dodoma Regional Referral Hospital; KDH, Kondoa District Hospital; KoDH, Kongwa District Hospital; MDH, Mpwapwa District Hospital.
Regarding macrolide subclasses, the three district hospitals demonstrated an almost equal use of erythromycin with a range of 92.5–97.2 compared with overall macrolides prescribed. However, there was very low utilisation of the newer generation azithromycin KDH (7.2±2.9%), KoDH (4.7±6.3%) and MDH (2.8±3.3%) district hospitals when to overall macrolides prescribed. The DRRH, in contrast, recorded a higher consumption of azithromycin at 56.5% and a lower prescribing rate of erythromycin at 34.4% (online supplemental table 3).
Supplemental material
Comparing the consumption of commonly prescribed antimicrobial formulations at the hospital level
Parenteral formulations
The most prescribed injectable across hospitals was ceftriaxone, with the DRRH having the highest prescribing level (62.4%), followed by MDH (45.2%), KoDH (34.2%) and, lastly, KDH (29.1%). DRRH and KoDH were leading in prescribed ampicillin injection at 20.8% and 17.8%, respectively. Furthermore, among the four hospitals, KoDH and KDH prescribed benzathine penicillin by far the most with a consumption rate of 18.8% and 14.7%, respectively, while all other hospitals demonstrated a prescription rate below 5%. Metronidazole was prescribed mainly by KoDH (26.3%) and MDH (12.5%). Benzylpenicillin was prescribed most often at the KDH (18.8%), followed by MDH (14.7%) and KoDH (5.9%). Gentamicin was prescribed by the KDH most often (18.3%), followed by the DRRH (9.3%). Procaine penicillin fortified, on the other hand, was prescribed the most by MDH (12.7%), followed by KDH (8.8%). In contrast, we observed an almost similar prescribing level of Ampiclox from the four hospitals (3.5%–8.8%) (online supplemental figure 1).
Consumption of selected commonly prescribed oral solid antimicrobial formulations
Analysis of the consumption of different solid antibacterial formulations commonly prescribed at the four hospitals shows that amoxicillin was most widely prescribed at two hospitals, KoDH and KDH (approximately 28% each), followed by DRRH (21.2%) and insignificant consumption at MDH. The utilisation of ciprofloxacin (fluoroquinolones) was higher in KDH (25.1%) than in the other three hospitals. Consumption of cloxacillin was only pronounced at KoDH (9.6%), while cotrimoxazole was prescribed most at DRRH (22.6%), followed by KoDH (21.0%) and then MDH (10.3%) with minimum use at KDH (5.2%). The utilisation of doxycycline was more common at MDH (24.4%), followed by KoDH (18.0%) and KDH (13.1%), while the DRRH had the lowest consumption rate (5.3%). The DRRH had a higher consumption of metronidazole (20.2%) compared with the three district hospitals: KDH (12.4%), MDH (9.2%), and KoDH (8.0%) (figure 2A).

(A) Comparative consumption of selected commonly prescribed oral solid antimicrobial formulations in DID percentages (ie, tablets and capsules). (B) Consumption of antibiotics and percentage change in the Dodoma Region. (C) DID comparison per antibiotic from 2013 to 2017 for the Dodoma Region.
Health centres
Consumption of selected antimicrobials at the health centre level
Amoxicillin (single penicillin) was the most consumed antibiotic, accounting for over one-third of the prescribed antibiotics. Cotrimoxazole—a combination sulphonamide—was found to be the second most prescribed antibiotic, followed by erythromycin and azithromycin (macrolides), fluoroquinolones and Ampiclox, a combination penicillin (online supplemental tables 1 and 2).
Daily Defined Dose/1000/outpatients/day for hospitals
Kondoa district had the highest DID, compared with the other districts, ranging from 16.88 to 30.95 for 2013–2017, the period of the study. The DID for the Mpanda district was the second highest with a range from 5.6 to 16.32, while CHA and Kongwa districts (KND) had the lowest consumption, with DID below three for the 5 years. The consumption for Kondoa District and Mpanda District was comparatively high when considering the total regional DIDs. The region’s total DID was 36.7343, 38.3098, 27.195, 36.4456 and 50.2776 for each year from 2013 to 2017 (figure 2). DID values increased by 4.3% from 2013 to 2014, decreased by 29.01% in 2015 and then increased by 34.12% in 2016 and a further increase of 37.95% in 2017 (table 1). The two-sample dependent t-test was carried out and indicated that average consumption was similar in 2013 (M=0.19) in district hospitals and in 2017 (M=0.24) with a p value of 0.8. (table 2). The mean of average consumption in health centres was 0.22 and a p value of 0.6. The correlation coefficient (multiple R) across the district hospitals indicated a strong linear relationship between the DID in 2013 and the DID in 2017 (table 1).
Consumption of commonly prescribed antibiotics in Dodoma Region health centres (%)
Comparison of consumption in DID between different districts in the Dodoma Region
Relative consumption for beta-lactamase-sensitive penicillins and combinations of penicillins, including beta-lactamase inhibitors, cephalosporins, fluoroquinolones and sulphonamide combination, were surveyed from 2013 to 2017 (figure 2B). Single penicillins were the most prescribed antibiotics group with a DID peaking in 2016 (11.65), but dropping in 2015 (6.68) with an annual average of 9.65 (table 2). From 2013 to 2017 in the Dodoma Region, single penicillins consistently had the highest Defined Daily Dose (DDD) values, averaging 9.7, while cephalosporins had the lowest, averaging 0.1. Notably, macrolides and sulphonamide combinations also showed significant usage, with average DID values of 3.1 and 3.2, respectively (table 3).
DID values for different groups of antibiotics in Dodoma Region (2013−2017)
Comparing hospitals with health centres
Comparing the DID values for health centres and district hospitals, the health centres had overall higher DID values than hospitals. The total DID for the hospitals was 11.8, 10.8, 7.4, 16.5 and 16.7 for each year from 2013 to 2017, while the corresponding DID values for health centres were 24.9, 22.2, 12.8, 21 and 24.2, respectively (figure 2C). There was a similar trend for both the health centres and hospitals. For 2013 and 2014, the DID values showed a similar utilisation trend, with values decreasing in 2015 and peaking up in 2016 and 2017.
Among the health centres assessed, MEN demonstrated the highest consumption rates, followed by KWA and HAM with a 5-year average of 68.1%, 9.2% and 8.3%, respectively (table 4).
Consumption in DID for health centres (%)
The DID (table 4) for health centres showed similar results as per DDD in percentage (online supplemental table 4), with MEN having the highest consumption for the 5-year period and MPY having the lowest DID values with an average of 0.3±0.1
Retrospective assessment of antimicrobial resistance
DRRH captures the entire catchment of the Dodoma Region; therefore, retrospective sensitivity data were available from 2013 to 2017 (table 5). Retrospective assessment of sensitivity data from 2013 to 2017 showed that the gram-negative isolates had the highest resistance rates among the tested antibiotics. The most resistant bacteria were Klebsiella spp, Proteus spp and P. aeruginosa, with strains isolated and tested for susceptibility, showing approximately 60% resistance to the antibiotics tested (table 5).
Percentage of bacteria strains that were resistant against commonly prescribed antibiotics (n=number of patient blood sampled cultured)
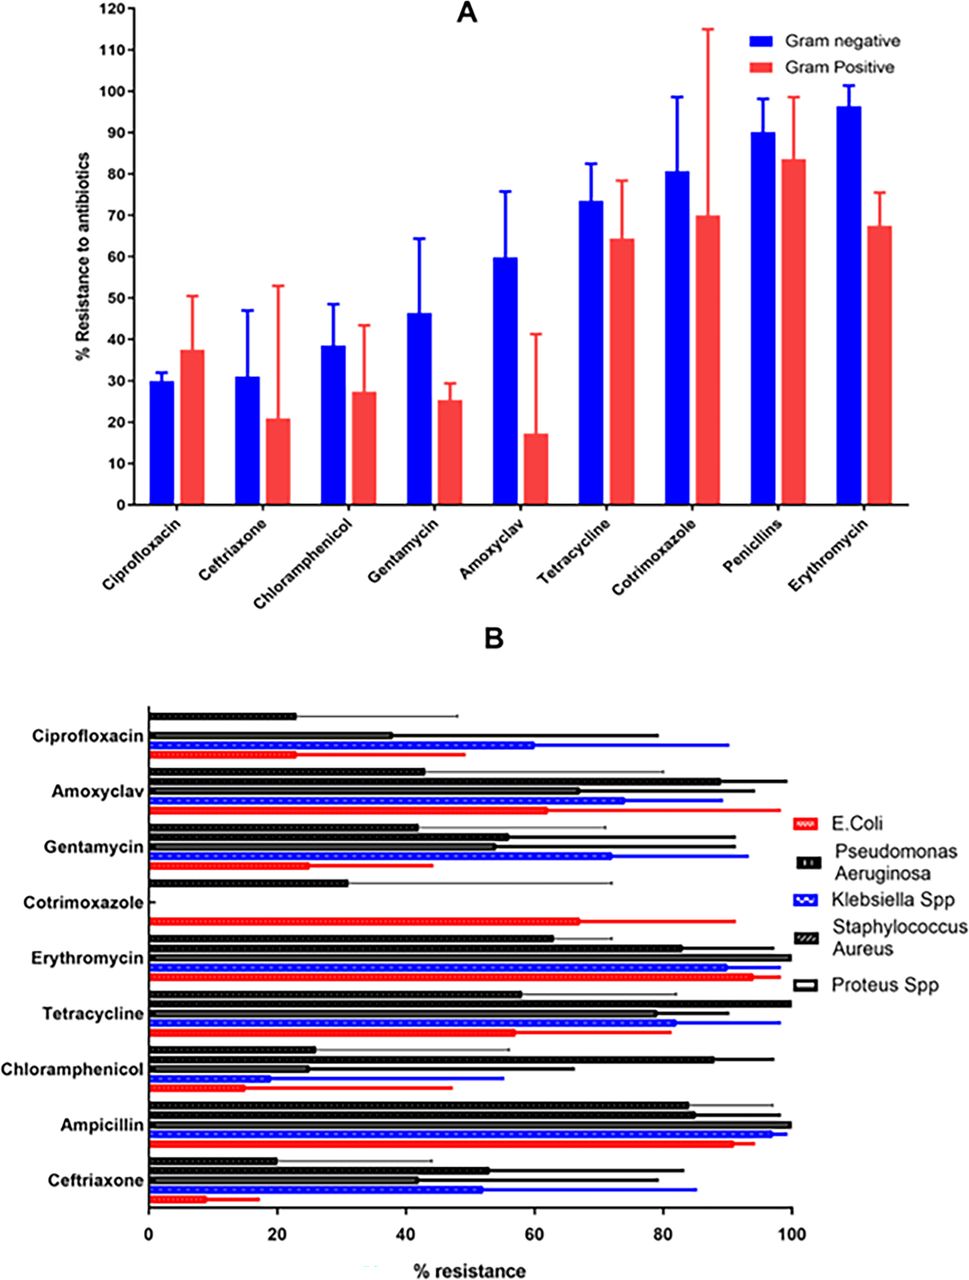
Several indicator drugs were tested for sensitivity against the isolated gram-negative and gram-positive bacteria. Penicillinase-sensitive penicillin antibiotics exhibited the highest resistance levels among the tested antibiotics, with a 5-year average resistance of 87.3%. In contrast, ceftriaxone showed the lowest resistance, with a 5-year average of 28.7% (online supplemental table 5). Further analysis of penicillinase-sensitive penicillin performance between the gram-positive and gram-negative bacteria revealed that the average resistance, over 5 years, against gram negatives was 90.1±8% and resistance against gram-positive 83.6±8% among the bacteria tested. The second antibiotic with high resistance was erythromycin, 96.4±5% and 67.5±8% against gram-negative and gram-positive bacteria, respectively.
The antibiotics that showed the lowest average resistance were ceftriaxone, ciprofloxacin and chloramphenicol with an average of 31.0%, 21% and 29.9% against gram-negative strains and 37.5%, 38.5% and 27.4% against gram-positive strains (figure 3A). When comparing the resistance rates of various antimicrobials against specific bacterial species, ceftriaxone showed resistance rates of 9% for E. coli, 52% for Klebsiella spp, 42% for Proteus spp, 53% for Pseudomonas aeruginosa and 20% for Staphylococcus aureus. The antibiotics with the highest resistance among these five bacteria were ampicillin and erythromycin. In contrast, cotrimoxazole exhibited the least resistance (figure 3B).

(A) Average resistance levels of antibiotics against gram-negative and gram-positive bacteria for 5 years between 2013 and 2017. (B) Average resistance levels of microbes against antibiotics tested for 5 years between 2013 and 2017.
Discussion
The lack of information has hindered rational discussions about Tanzania’s desirable antibiotic consumption levels. Having routine data on antibiotic consumption available for stakeholders and policymakers allows for better management and intervention planning to address the growing problem of antimicrobial overuse. It also allows for comparing the level of consumption with other similar populations and creating a context. This study compared the DID values for hospitals and health centres and found relatively higher DID values in the latter. In contrast, there was no significant difference in the antimicrobials used at primary health facilities and district hospitals. Increased consumption of antimicrobials at the health centre level compared with hospitals is a worrying trend that may be due to a lack of antibacterial stewardship, lower educational level of staff, poor prescribing practices or hesitancy to refer sicker patients to hospitals. The widespread and often uncontrolled use of fluconazole, both in healthcare and agricultural settings, could have played a significant role in fluconazole resistance. Additionally, the use of azole-based fungicides in agriculture, which are chemically similar to medical antifungals like fluconazole, can contribute to the development of cross-resistance in environmental fungi. The economic constraints in these areas often result in the use of suboptimal doses as the patients do not finish the treatment course.31 To address this issue, more restrictive guidelines on prescribing patterns in combination with retraining need to be put in place and monitored to curb the increasing AMC, especially at primary health facilities. The DID values calculated at the regional level were slightly higher than the reported national value of 27.29, as reported by the WHO Antimicrobial Surveillance Report of 2018.32
Intrafacility consumption comparison was performed, and the Pearson correlation (0.9 and 0.99, respectively) in both district hospitals and health centres indicates a strong positive correlation in the variables, with both moving in the same direction. The coefficient of determination (0.992) in the 2 years for all district hospitals showed a good fit of the values for regression. From the two-factor Analysis of Variance(ANOVA), the findings in district hospitals show of p value of 0.42 and an F value of 1.09, less than 0.05. This indicated no statistical difference in the means between 2013 and 2017 in the three hospitals. This was similar in health centres where the findings indicated a p value of 0.13, higher than the alpha of 0.05, and the F value is less than the F-crit meaning that we accept the null hypothesis that there is no statistical difference in the calculated means of the years.
The intrahealth centre comparison showed significant variation, with the health centre MEN showing the highest level of 68% of all the antimicrobials consumed (29-fold higher than at the DRRH). However, a closer investigation is needed to understand why MEN is such an outlier in the region. The comparison between hospitals showed a similar outcome to health centres, with DRRH, the regional hospital, having the lowest DID values and MDH having the highest values. The cause for this difference is, however, not known. Internationally, the reported district values were lower than in some countries, such as Mongolia (64.41) and similar to high antimicrobial consumers in Europe, for example, Greece and Cyprus ranging between 32 and 36 in 2016 and 2017.33
A further prominent outcome of the study was a similarly decreased consumption of antimicrobials in 2015 for both types of facilities. The findings from the Tanzania Service Provision assessment report on the availability of essential medicines, using the service readiness indicator methodology from WHO and US Agency for International Development (USAID),34 showed that only 70% of health facilities had the 14 essential medicines, indicating a critical shortage of medicines, especially antibiotics.
Besides poor prescription practices and misuse, the high DID values may also be explained by Tanzania’s high burden of infectious diseases and common presumptive treatment due to the low availability of laboratory diagnostic services in most of the facilities. Furthermore, it could indicate a prevalence of resistance, leading to health professionals prescribing for longer treatment periods than recommended in clinical guidelines. It could also be due to repeated treatment with the same antimicrobial when the condition does not improve and/or patients moving from one facility to another without reference to previous therapies. On the other hand, a study by Klein et al 35 links the increase in antibiotics consumption in low-income and middle-income countries over the years to the rise in gross domestic product per capita,35 leading to increased purchasing power of the population with a growing economy. However, this observation does not apply to this study of public health facilities in Tanzania since medicines are provided either for free or at a very low subsidised cost.
Evaluating the consumption of different antimicrobial groups from 2013 to 2017, penicillin was the most prescribed antibiotic with DID ranging from 6.68 to 10.63. This is similar to European countries where amoxicillin from 6.8 to 8.7,35 followed by macrolides from 0.16 to 2.9,33 is the most consumed antibiotics. The most consumed antibiotic in the current study was amoxicillin with a maximum DID value of 10.4 in 2017, which is 10 times the WHO recommended amount (1 g/day). Yet, consumption of amoxicillin reported in Tanzania is similar to worldwide trends32 and lower than in the USA and UK.36
Cephalosporins were the least prescribed antibiotics with a total DID ranging from 0.052 to 0.165. Overall, there was high consumption of penicillins and first-generation antibiotics of macrolides, cephalosporins and fluoroquinolones. The low DID values of higher generation antibiotics may indicate that organisms were still sensitive to the first-generation drugs. However, since the DID values were higher than the recommended WHO values, the low DID values for higher-generation antimicrobials could also be attributed to a lack of sensitivity studies or insufficient information on resistance profiles against the most common antimicrobials in the region. In addition, the high cost of wide-spectrum antibiotics may explain low DID values, as public health facilities are not able to supply even when needed.
Retrospective antimicrobial sensitivity test data revealed higher resistance rates in the gram-negative isolates (average 57.3±8.1) compared with the gram-positives (49.1±7.0) against the tested antibiotics. The most resistant bacteria were Klebsiella spp, Proteus spp and P. aeruginosa, with strains isolated and tested for susceptibility showing approximately 60% resistance to the antibiotics tested. These three bacteria are from the group of Enterococcus faecium, Staphylococcus aureus, Klebsiella pneumoniae, Acinetobacter baumannii, Pseudomonas aeruginosa, and Enterobacter spp (ESKAPE) pathogens declared by WHO as priority pathogens.37 They have built-in abilities to find new ways to resist treatment and pose a threat in hospitals, nursing homes and among patients who use devices such as ventilators and blood catheters.38 39
Several indicator drugs were tested for sensitivity against the assessed pathogens. The pencillin Sensitive (PS) antibiotics were the drugs that showed the highest levels of resistance among the antibiotics tested, with a 5-year average resistance of 87.3. This is aligned with other reports from the country.40 Further, following up on the performance of gram-positive and gram-negative bacteria, the 5-year average against gram negatives was 90.1±8% resistance against the bacteria tested. This is in line with previous reports from Tanzania that stated that due to the penicillinase enzyme in gram negative, these penicillins are ineffective.40 41 The second antibiotic with high resistance was erythromycin with a percentage resistance of 96.4%±5 and 67.5%±8 against gram negatives and gram positives, respectively. Regarding regional consumption, erythromycin was also the most consumed after the PS (pencillin sensitive) penicillins. There was high resistance to ceftriaxone; being an essential medicine, this is very concerning. However, several studies from other regions in Tanzania indicate a general practice where ceftriaxone significantly used inappropriately in both private hospital and public hospital which is against the Tanzania standard treatment guidelines in treating infections and perceived infections.31 42 43 This misuse might be the reason for high rates of resistance. High consumption may be part of a reinforcing cycle of the ineffectiveness of this class of antibiotics resulting from repeated prescribing because of perceived ineffectiveness. Repeated course prescriptions may stem from prescribers’ assumptions that treatment failure is due to an inadequate treatment course or patients moving between health facilities and ending up with the same antibiotic. In Tanzania, patient treatment records typically remain at the facility and are not shared with other facilities. Additionally, the high DID values related to PS penicillins (eg, amoxicillin) and macrolides (eg, erythromycin) in the region may contribute to the relapse of infections being treated. This correlation of high consumption with high resistance levels has been described in a non-systematic review and meta-analysis on the relationship between consumption of antibiotics and the development of E. coli resistance.44 The present study revealed that antibiotics with the lowest resistance (ie, highest sensitivity) were ceftriaxone, ciprofloxacin and chloramphenicol. These results are comparable with observations on AMR in Africa shown in a recent systematic review.45 This study revealed a potential link between AMC and resistance patterns. Drugs with high levels of resistance often corresponded to those with the highest consumption rates, as indicated by their DID values. This may suggest that increased antimicrobial use may be contributing to the development of resistance in bacterial populations. However, while this was observed, causation cannot be definitively established without further investigation. The relationship between consumption and resistance is complex and may be influenced by various factors beyond just usage rates.
Conclusions
This study represents a first attempt to collect AMC data at both the regional level and user points in Tanzania. While our data represent only a fraction of total AMC, they reveal a critical issue excessive antimicrobial use contributes to alarmingly high AMR. These findings underscore the urgent need for immediate interventions to address AMR, particularly at primary healthcare facilities where antimicrobial misuse is prevalent.
To effectively mitigate AMR and AMC, it is essential to monitor changes in consumption and resistance over time. Our study presents a resource-efficient method for AMC and AMR surveillance, offering a scalable approach that may apply to similar settings. Continuous surveillance of bacterial resistance and AMC is crucial to capturing regional variations, informing evidence-based interventions and guiding policy decisions.
A comprehensive, coordinated strategy is needed to prevent antimicrobial misuse. A key component of this strategy should be strengthening laboratory capacity for sensitivity testing to improve diagnostic accuracy and antimicrobial stewardship. Additionally, more restrictive prescribing guidelines, coupled with targeted retraining for healthcare providers, are necessary to curb rising AMC, particularly at primary healthcare facilities. Without urgent action, escalating resistance rates will continue to pose a significant public health challenge, threatening patient outcomes and the effectiveness of available treatments.
Limitations of the study
One of the key limitations of this study is the reliance on stock records and drug registry files and patient prescriptions, which may result in an incomplete representation of actual AMC patterns and the use of antimicrobial sensitivity data from only one hospital laboratory. Moreover, the study does not examine the appropriateness of prescribing practices or reasons for antibiotic use, and by focusing on high-volume facilities, it may have overlooked patterns in smaller health centres. These limitations, plus the exclusion of over-the-counter sales, suggest that the reported antibiotic consumption values are likely conservative estimates of true community-wide use in the region.
Data availability statement
Data are available upon reasonable request. Raw data will be shared upon request from the corresponding author.
Ethics statements
Patient consent for publication
Ethics approval
Not applicable.
Acknowledgments
The study was conducted on behalf of the Health Promotion and System Strengthening Project (HPSS) in Dodoma Region, Tanzania. Swiss TPH was mandated with the implementation of this project. We would like to acknowledge the Ministry of Health employees and administrators in the Dodoma Region for their cooperation and assistance during the study.
References
Footnotes
X @nzorinzo
Contributors RM: conceptualisation, methodology, formal analysis, investigation and writing–original draft. CAO: conceptualisation, methodology and writing–review and editing. EO: writing–review and editing. RMK: writing–review and editing. SM: writing–review and editing. KW: conceptualisation, review and editing and overall supervision, guarantor.
Funding This research received funding from the Swiss Agency for Development and Cooperation (SDC) (Grant number Phase 7F-07381.02.01, Contract No. 81035072).
Competing interests None declared.
Patient and public involvement Patients and/or the public were not involved in the design, or conduct, or reporting, or dissemination plans of this research.
Provenance and peer review Not commissioned; externally peer reviewed.
Supplemental material This content has been supplied by the author(s). It has not been vetted by BMJ Publishing Group Limited (BMJ) and may not have been peer-reviewed. Any opinions or recommendations discussed are solely those of the author(s) and are not endorsed by BMJ. BMJ disclaims all liability and responsibility arising from any reliance placed on the content. Where the content includes any translated material, BMJ does not warrant the accuracy and reliability of the translations (including but not limited to local regulations, clinical guidelines, terminology, drug names and drug dosages), and is not responsible for any error and/or omissions arising from translation and adaptation or otherwise.