Article Text

Abstract
Objectives In lung transplantation (LTx), a priority is assigned to each candidate on the waiting list. Our primary objective was to identify the key factors that influence the allocation of priorities in LTx using machine learning (ML) techniques to enhance the process of prioritising patients.
Design Developing a prediction model.
Setting and participants Our data were retrieved from the United Network for Organ Sharing (UNOS) open-source database of transplant patients between 2005 and 2023.
Interventions After the preprocessing process, a feature engineering technique was employed to select the most relevant features. Then, six ML models with optimised hyperparameters including multiple linear regression, random forest regressor (RF), support vector machine regressor, XGBoost regressor, a multilayer perceptron model and a deep learning model were developed based on the UNOS dataset.
Primary and secondary outcome measures The performance of each model was evaluated using R-squared (R2) and other error rate metrics. Next, the Shapley Additive Explanations (SHAP) technique was used to identify the most important features in the prediction.
Results The raw dataset contains 196 270 records with 545 features in all organs. After preprocessing, 32 966 records with 15 features remain. Among various models, the RF model achieved a high R2 score. Additionally, the RF model exhibited the lowest error values, indicating its superior precision compared with other regression models. The SHAP technique in conjunction with the RF model revealed the 11 most important features for priority allocation. Subsequently, we developed a web-based decision support tool using Python and the Streamlit framework based on the best-fine-tuned model.
Conclusion The deployment of the ML model has the potential to act as an automated tool to aid physicians in assessing the priority of lung transplants and identifying significant factors that play a role in patient survival.
- Machine Learning
- Pulmonary Disease
- Transplant medicine
Data availability statement
Data may be obtained from a third party and are not publicly available. The data used in this article can be obtained from the United Network for Organ Sharing (UNOS) database (www.unos.org/data). However, there are limitations on accessing this data, as it was used under a license for the current study and is not accessible to the general public. The interpretation and reporting of this data are the responsibility of the authors and in no way should be seen as an official policy of or interpretation by the OPTN or the United States government.
This is an open access article distributed in accordance with the Creative Commons Attribution Non Commercial (CC BY-NC 4.0) license, which permits others to distribute, remix, adapt, build upon this work non-commercially, and license their derivative works on different terms, provided the original work is properly cited, appropriate credit is given, any changes made indicated, and the use is non-commercial. See: http://creativecommons.org/licenses/by-nc/4.0/.
Statistics from Altmetric.com
STRENGTHS AND LIMITATIONS OF THIS STUDY
The use of various preprocessing and data cleaning techniques in our survey increased the robustness and performance of the model.
To ensure transparency and interpretability in our machine learning models, we employed Explainable Artificial Intelligence techniques, specifically the Shapley Additive Explanations method.
Understanding the factors influencing the determination of lung transplant priority could support clinicians in designing treatment plans and thus improving the quality of life of patients.
Deploying the developed machine learning model in the form of a decision support system increases its applicability in clinical practice.
The model was validated on the United Network for Organ Sharing dataset but requires external validation across diverse populations and healthcare systems to ensure generalisability and clinical applicability.
Introduction
Lung transplantation (LTx) is an advanced treatment option for patients suffering from end-stage lung disease. When no other treatment options are available and the patient is likely to die, lung transplant surgery is suggested as a well-established treatment option.1 When a patient meets the inclusion criteria for transplantation, they are placed on a waiting list and assigned a priority. Various conditions may affect eligibility for LTx and the patient’s priority.2 In some countries, a score is assigned to each patient on the waiting list to enhance the recipient selection process.3 4 Understanding the most influential factors in priority allocation for LTx is beneficial for researchers worldwide, as it can improve post-transplant survival. Using data mining methods and developing forecasting models in this field could aid clinicians in uncovering hidden patterns and relationships within patient data and allocation scores.
Machine learning (ML) methods have been developed across various fields of clinical medicine to assist clinicians in predicting and classifying diseases.5 These methods are used to predict the length of stay in the intensive care unit, diagnose septic infection6 and extract disease patterns from big data.7 8 Nevertheless, there is a lack of studies on the development of predictive models and identification of important features using ML methods to predict LTx priority.9 10 Thus, the primary objective of this study was to use ML techniques to identify the most influential factors that strongly impacted outcomes based on various developed ML methods to predict the priority using clinical and demographic data.
Methods
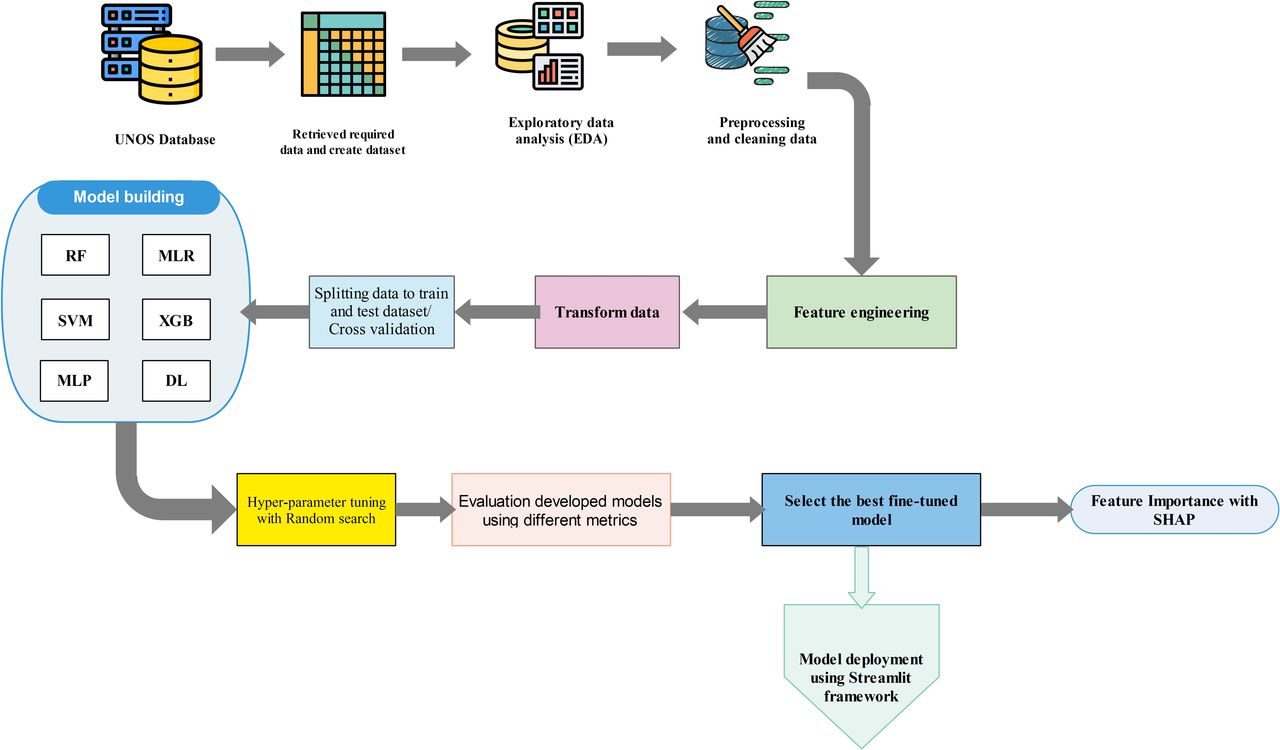
Throughout this section, the process of developing, comparing and evaluating ML models is shown schematically in figure 1. Python programming language, V.10, was used in this study for developing and validating ML algorithms. For data preprocessing, Numpy and Pandas modules were employed, while the scikit-learn library was used for developing supervised classifier algorithms.

Schematic diagram illustrating the proposed methodology for developing machine learning models. The process includes data preprocessing, feature engineering, model training and evaluation, followed by a systematic comparison of multiple models using performance metrics to identify and select the optimal model for deployment. DL, deep learning; MLP, multilayer perceptron; MLR, multiple linear regression; RF, random forest; SHAP, Shapley Additive Explanations; SVM, support vector machine; UNOS, United Network for Organ Sharing; XGB, XGBoost.
Dataset description and data retrieval
The data for this study were obtained from the UNOS online database.11 On receiving written permission from UNOS, we accessed the recorded data pertaining to LTx for our research. Our study included patients over 18 years old with end-stage lung disease who underwent lung transplants between 2005 and 2022. We performed a waiting list analysis using all available data entries from the UNOS database for our study.
The priority of candidates on the waiting list was considered as the outcome, while the clinical and demographic characteristics of patients were considered as features or predictors.
Preprocessing process
Data preprocessing is a crucial step in ML techniques, especially when dealing with raw data from clinical databases or medical records that often contain missing or unclear information. To ensure the development of more accurate models based on appropriate data, we followed a series of data preprocessing steps. The following steps were employed in this phase as preprocessing techniques.
Checking the duplicated values and records to remove the duplicates.
De-identify records and remove irrelevant features.
Convert nominal and categorical features to numerical values.
Identify missing data and missing values imputation.
Outlier detection.
Feature engineering and feature selection.
Data transformation and normalisation.
Duplicate checking and removal of irrelevant features
After duplicate checking, we consulted UNOS guidelines and experts to review all features and their definitions. Under their supervision, we removed identification variables and irrelevant features, such as ID columns, hospital centre identification codes and country of residence, to de-identify patients.
Following this, we converted the post-transplant survival days variable to years and excluded patients with a survival rate of less than 2 years. Next, we filtered out patients below 18 years of age and excluded any data before 2005. Additionally, records related to heart transplantation were removed from the dataset.
After removing irrelevant features in the first data-cleaning phase, we used the discretised operator to convert nominal values to numerical data. Categorical data were encoded using the LabelEncoder class too.
Missing data management
To address missing data in our dataset, we conducted missing data imputation across the entire dataset. Initially, we assessed the specified columns or attributes to determine the extent of missing and unique data in each column. During this analysis, we discovered that the ICU column was empty and decided to delete it due to its lack of meaningful information. To impute the missing data, a threshold of 80% was set for feature removal with expert consultation. As a result, any column with more than 80% missing data was removed. If the missingness is due to inconsistent reporting rather than clinical irrelevance, dropping the column could exclude critical information about high-risk patients. In this case, domain experts might recommend retaining the column and using advanced imputation techniques or creating a binary indicator for missingness.
Along with feature removal, the sensitivity analysis was conducted on the dataset, which revealed that the inclusion of omitted features had a detrimental effect on the performance of the random forest (RF) regressor model. Specifically, these features led to a decrease in the R² score from 0.95 to 0.68 and an increase in root mean square error (RMSE) from 3.5 to 4.8. It means that the sensitivity analysis demonstrated that omitting features with missing data significantly degraded model performance (R² decreased from 0.95 to 0.68; RMSE increased from 3.5 to 4.8), suggesting these missing values were not missing at random (MNAR). The observed performance drop implies that the missingness may depend on unobserved factors systematically related to the outcome, warranting MNAR-specific methods for robust inference.
For the missing data imputation, we adopted a strategy of replacing missing data in numerical features with the mean value of each respective feature. This approach allows us to retain the integrity of the dataset while minimising the impact of missing data on our analysis. By performing these comprehensive steps of missing data imputation, we ensure the dataset is optimised for further analysis and modelling, enabling us to draw more accurate conclusions and insights.
Outliers handling
Outliers can significantly impact the performance and interpretability of ML models. Therefore, it is essential to investigate their causes before deciding whether to exclude, transform or retain them. This exploration ensures that the preprocessing steps are justified and scientifically sound. To address outliers in the dataset, we first create distribution plots to visualise the data. Next, we apply the IQR method and use box plots to identify outliers. Finally, we remove these outliers to prepare the data for further processing.
To address outliers in the dataset, a comprehensive approach was employed that included visual and statistical analysis to identify and understand the nature of the outliers. The distribution plots and boxplots were created to visualise outliers and applied the IQR method to quantify their extent. Additionally, statistical analysis was conducted to assess the impact of outliers on the dataset, and sensitivity analysis was performed to evaluate their influence on model performance. Throughout this process, we ensured transparency and justification by documenting all outliers and providing context-specific reasons for their exclusion, such as data entry errors or clinically irrelevant extreme values.12 13 This rigorous approach ensured that the removal of outliers was methodologically sound and did not compromise the integrity of our analysis.
Feature engineering and feature selection
Given the high-dimensional nature of the dataset used in this study, feature engineering and selection were critical steps to reduce dimensionality, eliminate irrelevant or redundant features and enhance model performance. Feature selection aims to identify a subset of features that effectively describe the problem with minimal loss of information and computational efficiency.14 All phases of feature engineering and selection were conducted under the supervision of clinical experts to ensure the relevance and validity of the selected features.
Step 1, correlation analysis
As the first step, correlation analysis was performed to assess the relationships between features and the target variable, as well as interfeature correlations. This analysis helped identify highly correlated features that could introduce multicollinearity and redundancy into the model using a heatmap graph. Features with a correlation coefficient above a predefined threshold were flagged for further evaluation.
Step 2, variance threshold filtering
To eliminate low-variance features that contribute little to the model’s predictive power, a variance threshold was applied. Features with variance below a specified threshold (eg, 0.01) were removed, as they were deemed to have minimal impact on the target variable.
Step 3, embedded feature selection with XGBoost
Following the initial filtering, an embedded feature selection technique was employed using the XGBoost algorithm. XGBoost provides intrinsic feature importance scores based on metrics such as gain, cover and frequency. Features with very low importance scores (negative scores indicating no correlation with target value) were excluded from the final feature set.
Step 4, expert review and validation
All selected features were reviewed and validated by subject matter experts to ensure their clinical, practical and scientific relevance. This step was critical to avoid eliminating features that, although statistically significant, may not be clinically significant. For example, some features were retained for model customisation based on expert consultation, despite having modest statistical significance.
Through a comprehensive and expert-guided feature selection process, we identified a subset of features that were statistically significant, domain-relevant and impactful for model performance. This rigorous approach ensured the final model was both robust and clinically meaningful, with the selected features deemed critical for predicting the target variable.
Data transformation and normalisation
In the end, data normalisation was carried out to optimise the features for modelling purposes.
Splitting data and validation technique
During the model development process, the dataset was divided into training and testing data in an 80:20 ratio where 80% of the data were used for training the models and the remaining 20% were reserved for testing and validation. The training dataset is used to train the model, allowing it to learn patterns and relationships within the data based on the available data. The training dataset typically contains the bulk of the available data. In contrast, the testing dataset is intended solely to evaluate the model’s performance on unseen data, ensuring an unbiased assessment of its generalisability. This dataset is kept separate from the training process to provide a true measure of how the model performs in real-world scenarios. Both datasets are often split randomly, with common ratios such as 80:20 or 70:30, depending on the size and nature of the data.
This split ensured that the models were evaluated on unseen data to assess their generalisation capability. To mitigate potential bias introduced by simple data splitting, the cross-validation technique was employed. Through this technique, the dataset was divided into k folds, and each model was trained and validated k times, with each fold serving as the validation set once. The average performance metrics across all folds were calculated to ensure robust evaluation. The results of the k-fold cross-validation were consistent with those obtained from the simple 80:20 split, confirming the reliability of the initial approach.
Model development and tuning
The objective of this study was to develop a prediction model for a continuous numerical variable (priority score) using regression techniques to identify the most effective factors in selecting the most appropriate candidate for LTx. In this study, regression models were selected to examine the connection between input variables and output numerical values, as the target variable (outcome) is a continuous numerical value.
To determine the most influential factors and identify the best model, the performance of six regression-based models was evaluated: multiple linear regression (MLR), RF regressor, support vector machine (SVM) regressor, XGBoost regressor, a multilayer perceptron model (MLP—a class of feedforward artificial neural network) and a deep learning (DL) model. The selection of these models was done based on the type of target variable and the study objectives.
A hyperparameter tuning optimisation technique was employed in this phase to improve model performance by optimising the training process by determining the best hyperparameters for each model. This technique was used to prevent models that underfit or overfit the data.15 After tuning parameters in each model, the models were trained with updated best hyperparameters, and all metrics were calculated again to achieve the best performance. We employed the random search method, a hyperparameter tuning technique where hyperparameters are randomly chosen from a predefined set to train a model.
Multiple linear regression
MLR is a statistical technique used to estimate the relationship between a dependent variable and one or more independent variables. It is an extension of linear regression, which requires more than one predictor variable to forecast the response variable.16 MLR is a significant regression algorithm that models the linear association between a dependent continuous variable and multiple independent variables.17 Hence, we have chosen this model to predict the continuous variable (priority score) based on several independent variables. The equation for MLR is demonstrated below17:

where y represents the priority; x i is the considered variables; β0 is the intercept; and βi is the regression coefficients.
RF regressor
The RF regressor algorithm is a kind of ML approach that employs a group of decision trees, which are trained on a subset of the data, to make predictions. This technique is designed to stabilise the algorithm and decrease variance by using multiple trees. The RF regressor algorithm is widely recognised as a popular model in developing regression models because of its strong performance with large datasets and diverse data types.18 19
SVM regressor
SVM regression is a versatile regression function that can be used to solve both classification and regression problems. SVM is a supervised learning algorithm that fits a regression to the training data by reducing the distance between the sampled points and the fitted hyperplane.20 21 One advantage of SVM is that it is a sparse algorithm, meaning that it only needs information from a limited number of data points.22
XGBoost regressor
Extreme Gradient Boosting (XGBoost) is another ML library that is available for free and offers a powerful and efficient implementation of the gradient boosting algorithm.23 Gradient boosting is a technique that involves creating an ensemble of tree-based models and then combining them to create a more accurate overall model than any of the individual models in the sequence.24 XGBoost is a popular choice for those who require an effective and optimised implementation of gradient boosting.25
MLP model
The MLP is considered one of the top regression models in the field of artificial neural networks. It is equipped with the capability to learn from training data using a variety of training algorithms and rules. This feature allows the MLP to acquire numerous advantages, including increased capacity. As a result, the MLP operates as a self-regulating model that uses specific learning algorithms to enhance its performance when encountering new inputs.26 27
DL model
A DL model can be used for regression problems by learning a mapping from input features to the target output. DL is an adaptable model proficient at effectively managing intricate data relationships. It proves especially beneficial when working with extensive datasets where traditional regression methods might not uncover intricate patterns. Nonetheless, to prevent overfitting and attain peak performance, these models necessitate meticulous calibration and validation.28–30 Occasionally, due to the complex nature of implementing these models, simpler regression models may outperform them.
Performance evaluation
Typically, regression models are evaluated based on a function that measures the difference between the predicted and actual numerical value of the target variable, such as the priority score.31 In this study, three popular evaluation metrics were used, including mean absolute error (MAE), RMSE and R2 score to assess the performance of the developed models.32


In these formulas, variable n refers to the number of samples;  denotes the retrieved value predicted by the model;
  denotes the analysed value; and
  denotes the average analysed value.
To validate the developed (ML models and reduce bias, we employed k-fold cross-validation. This technique overcomes the limitations of a simple train/test split by dividing the available data into multiple folds or subsets. By averaging the results across these folds, we achieve a more robust estimate of the model’s performance compared with a simple train/test split.
Feature importance
To implement explainable AI (XAI), a technique employed to elucidate the impact of each feature on the model is the SHAP (Shapley Additive Explanations) method. The SHAP method aims to enhance the transparency and interpretability of ML models by drawing on cooperative game theory.33 For instance, linear models use their coefficients to gauge the significance of each feature. However, these coefficients are influenced by the scale of the variable itself, potentially resulting in misinterpretations.34 The same can be found in tree-based models for feature ranking. This is precisely why SHAP becomes valuable for model interpretation.35 The absolute value of SHAP provides insight into how significantly an individual feature influences the prediction.36 Once we identify the optimal model for priority prediction, we’ll leverage the SHAP technique to assign weights to the most critical features. These features will then be ranked based on their importance and impact on the final priority score.
Patient and public involvement
Patients and/or the public were not involved in the design, or conduct, or reporting, or dissemination plans of this research.
Results
Dataset description
The raw dataset including all organs comprises information on 1 96 270 patients who underwent LTx, as well as data related to lung donors. This comprehensive dataset includes 545 features, encompassing demographic and clinical details about the organ recipients, biomarkers, laboratory test results and characteristics of the donated organs (online supplemental table A-2 in appendix A). Additionally, it provides insights into various patient outcomes, such as post-transplant survival rates, occurrences of acute organ rejection, priority levels, duration of ICU stay, post-transplant infections and instances of retransplantation.
Supplemental material
To preprocess the dataset, we converted the transplantation date data type to a string format and extracted the year column by parsing the month, hour and year components. We removed all data prior to 2005 due to the absence of a prioritisation system during that period. Furthermore, to focus exclusively on adult transplants, we excluded information related to paediatric transplants for children and adolescents under 18 years of age. As a result, our initial dataset comprised 183 086 records.
Subsequently, we filtered the dataset to include only post-transplant survival records exceeding 1 year. After that, we eliminated any records with missing priority scores. Ultimately, our final dataset consisted of 45 966 records for subsequent analysis.
Exploratory data analysis
Following imputation of missing independent variable data and preprocessing steps, the overall patient population consisted of 66.88% men and 33.20% women, with a median age of 54.27±14.24 years. Our target variable is the priority (or allocation) score, which represents a continuous numerical value. In online supplemental table A-1 in appendix A, we present descriptive analysis and the frequency distribution of various demographic and clinical variables within the dataset.
Furthermore, we employed a data visualisation method to enhance our comprehension of the data and dataset. This approach aids in verifying the integrity of the data and detecting any apparent inaccuracies. Incorporating data visualisation is essential for all data science projects across various fields.37
Data cleaning and preprocessing
In the method section, we present detailed information regarding preprocessing procedures applied to the whole dataset. After de-identifying the dataset, it was limited to 40 024 records and 445 features. During the initial data cleaning phase, we removed irrelevant features, reducing the total to 322. Subsequently, we performed missing values imputation, resulting in 215 features available for further analysis. Next, in the correlation analysis phase, our dataset contains over 165 features postprocessing–preprocessing.
Due to the dataset’s high dimensionality, we applied preprocessing techniques to select only the most important features based on their importance scores. As a result, we narrowed down the dataset to 65 features in the first phase of feature engineering. After further applying feature engineering and selection techniques, our final dataset consisted of 32 966 records, containing 15 features.
Development and evaluation of regression models
The prediction models were developed by training several selected features obtained during the feature engineering phase. We used 80% of the dataset to train the algorithms and the rest 20% to test and validate their efficacy (80:20), and all six regression algorithms were trained based on trained data.
To address the bias of training using simple data splitting the average score, k-fold cross-validation was done, and k was considered as 10 folds. The results showed that average scores of 10-fold cross-validation in six ML algorithms are the same as the simple splitting data process. Subsequently, the hyperparameters were fine-tuned using a hyperparameter tuning technique to enhance the performance of the developed models.
The optimised and selected hyperparameters are documented in table 1. Next, the MAE, RMSE and R2 values for each optimised model were calculated and represented in table 2. Finally, all the optimised ML models were compared based on their R2 scores in combination with other relevant metrics. In this task, the RF regressor emerges as the most robust model, demonstrating superior performance with an impressive 95.168% R² value, which indicates it explains nearly 96% of the variance in the data, significantly outperforming other techniques. The adjusted R² metric, which penalises unnecessary model complexity, closely mirrors the standard R² here (95.163%). The model’s exceptional performance is evidenced by its lowest mean squared error (12.548), MAE (2.056) and RMSE (3.542), suggesting highly accurate and precise predictions. The superior performance of the RF model can be attributed to its ability to handle complex, non-linear relationships in medical data through ensemble learning, where multiple decision trees are combined to create a more flexible and generalised predictive model. In contrast, traditional linear methods like linear regression and SVM struggled, achieving R² values below 53%, which suggests the priority prediction requires sophisticated, non-linear modelling approaches that can capture intricate patterns in medical datasets. The progression from linear to ensemble and advanced ML techniques clearly demonstrates the importance of selecting appropriate algorithms for complex predictive challenges in healthcare.
The best selected hyperparameters
The evaluation metrics of developed models and comparison of the model performance
As a result, the RF regressor model emerged as the top performer among the developed prediction models. We made this determination based on a comprehensive evaluation of various metrics, using the best features.
Most important features to select the most appropriate candidate
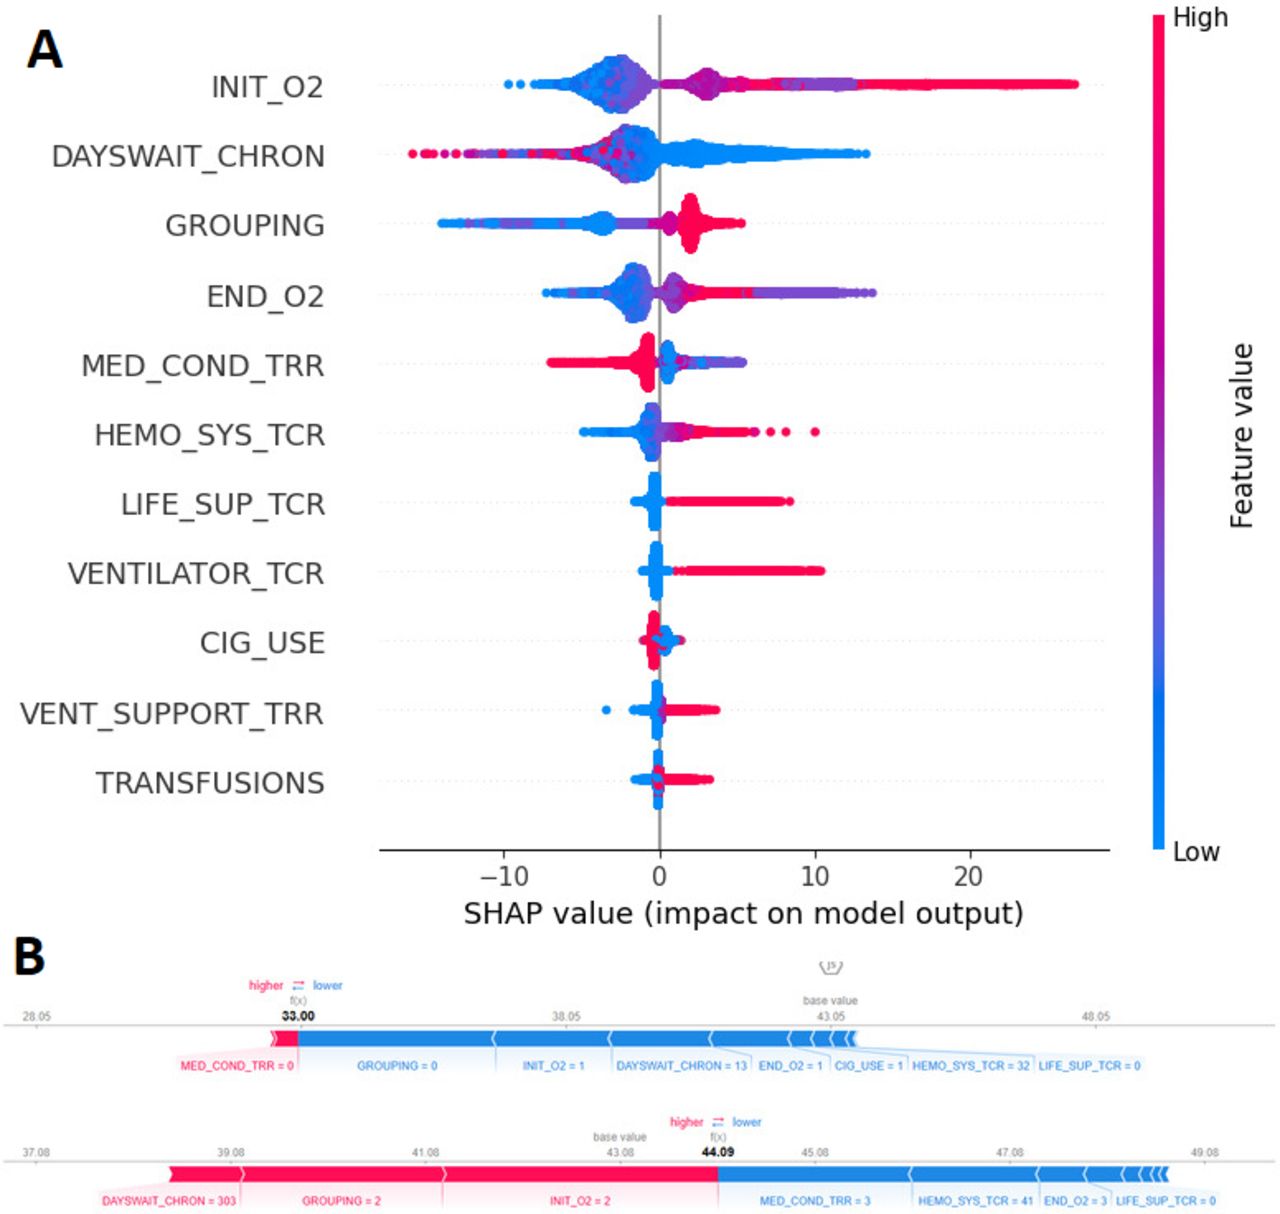
On selecting the best model, we proceeded to identify and weigh the most influential features using the SHAP library within the final model. Initially, a prediction model based on the chosen regression model was created. Subsequently, the importance of each feature was determined by analysing the set of trees generated by the model using the SHAP technique. The SHAP library assigns a score to each feature based on its impact on the prediction model. The ranking of the variables used in the ultimate model is visually represented in figure 2, which is a widely recognised and popular chart produced by SHAP.

(A) SHAP summary plot of the top 11 features for predicting lung allocation score using random forest regressor and (B) SHAP values to explain the predicted probabilities. SHAP, Shapley Additive Explanations.
Ultimately, the researchers pinpointed the 11 most effective features, each receiving the highest score in candidate prioritisation.
These features, along with their explanations, are detailed in table 3. Notably, it showed that factors such as a patient’s oxygen consumption and diagnosis played a significant role in prioritising the waiting list. Additionally, the patient’s waiting time on the transplant list emerged as another influential factor. Subsequently, we developed a web-based decision support tool using Python and the Streamlit framework based on the best-fine-tuned model (figure 3).

Interactive web-based interface for the machine learning model, developed using the Streamlit framework. The tool allows users to input data, visualise predictions and explore model performance metrics in real-time, providing an accessible platform for researchers and practitioners to interact with the developed algorithm.
The top 11 features identified by the SHAP method based on the prediction model
Discussion
The study aimed to explore the feasibility of using ML methods to predict priority levels for patients on the waiting list for lung transplants and to pinpoint the critical factors influencing priority allocation. Despite the potential advantages of employing ML algorithms in organ allocation,38 there is a lack of research on their application specifically in LTx. This investigation led to the development of a decision support tool for estimating transplantation priorities.
Currently, the decision-making process for prioritising individuals on organ transplant waiting lists is predominantly reliant on physicians’ subjective judgements, often following ‘first-come, first-served’ or ‘longer waiting time’ principles rather than using sophisticated mathematical models.39 40 Researchers recommend that authorities explore more equitable and innovative solutions for allocating donor organs to patients on waiting lists. As a result, researchers in the field of transplantation have concentrated on developing advanced models to forecast priority rankings and outcomes for recipients based on pretransplantation factors.41 42 Similarly, we employed ML models to investigate more appropriate factors in assigning organs to recipients.
Prior studies on organ allocation have focused only on classification models to predict the risk of mortality following transplantation.41 43 However, these approaches have not been highly effective in improving the prioritisation of patients on lung transplant waiting lists.44 45 In contrast, our developed model takes into account various factors such as disease type, oxygen saturation, demographics, clinical tests and functional status.
In the context of ML, the effectiveness of methods depends not only on their design and techniques but also on the quality and suitability of the data they operate on. To overcome the limitations of prior research, which often relied on a single ML technique and small sample sizes, our study takes a different approach. We incorporate multiple ML techniques to enhance the accuracy of our results, leveraging a large dataset sourced from the UNOS database.
Our algorithm yields slightly superior results. To enhance the robustness of our model, we employed various data preprocessing techniques and feature engineering methods. These approaches allowed us to identify the most relevant and informative features in the data while discarding redundant or noisy ones.46 47 Data preprocessing plays a crucial role in improving data quality and enhancing the accuracy of knowledge extraction.48 Additionally, by reducing data complexity and dimensions, our models became better equipped to capture underlying patterns and relationships, resulting in improved predictive performance.10 47
Our analysis reveals that employing the RF regressor model, which incorporates 15 features from the most significant donor and recipient variables available prior to transplantation, represents an effective approach for assigning an allocation score to each candidate on the waiting list. This outperforms other regression models. RF was specifically chosen due to its favourable prediction performance in previous research.49 Implementing the developed model as an AI-based decision support tool could assist physicians in integrating clinical insights into their decision-making processes and point-of-care scenarios, thereby enhancing the practical utility of the data.
ML-based models rely on intricate mathematical structures and multidimensional datasets, often yielding complex patterns and relationships that can be challenging for humans to grasp. To address this complexity and limitation, researchers have turned to SHAP summary analysis. This technique identifies the top influential features within the final model. By doing so, it sheds light on which parameters should take precedence when selecting the most suitable recipient with the highest priority—a factor that has not received extensive exploration in prior studies. On the other hand, as the research community increasingly shifts towards XAI methods,50 51 the adoption of this approach represents a significant step forward. By employing XAI techniques, the performance of developed models can be interpreted and explained more transparently, fostering greater trust and understanding in their outcomes.
Our study possesses some limitations. Despite the dataset under consideration being of a substantial size, it was obtained from a freely accessible dataset, aligning with the structure of the UNOS database will allow for the collection of patient information tailored to researchers’ requirements. While our study demonstrates the effectiveness of the RF model in predicting outcomes for lung transplant patients using the UNOS dataset, it is important to note the lack of external validation as a limitation. The model was developed and validated only on the UNOS dataset, which, although comprehensive, may contain biases related to specific populations and practices in the USA. However, we plan to focus on collaborating with international transplant registries or multicentre studies to validate the performance of the model in different populations and healthcare settings. This will enhance the validity of the model and its potential for widespread clinical adoption. External validation on independent datasets from different geographic regions or healthcare systems is essential to ensure the generalisability and robustness of our findings. As part of future work, we are developing an intelligent lung transplant patient information system at our centre. Building on previous efforts to apply AI-based techniques in solid organ transplantation,52–55 this system aims to integrate the current model with patients’ medical records while leveraging additional AI-based models to enhance its performance.
Conclusion
During this study, we succeeded in developing a priority prediction model based on the huge data of the UNOS database using ML models with the least error. Our research is among the pioneering studies that employ the SHAP method as an XAI technique to enhance the comprehensibility of the proposed model intended for clinicians. Additionally, the automated auxiliary model that we created can assist clinicians in acquiring a better understanding of the transplant priority estimation and the crucial factors that influence patient survival.
Data availability statement
Data may be obtained from a third party and are not publicly available. The data used in this article can be obtained from the United Network for Organ Sharing (UNOS) database (www.unos.org/data). However, there are limitations on accessing this data, as it was used under a license for the current study and is not accessible to the general public. The interpretation and reporting of this data are the responsibility of the authors and in no way should be seen as an official policy of or interpretation by the OPTN or the United States government.
Ethics statements
Patient consent for publication
Ethics approval
The research was approved by the Tehran University of Medical Sciences Ethics Committee (IR.TUMS.IKHC.REC.1401.143). All methods were performed based on the relevant guidelines and regulations. Consent for participation was deemed unnecessary according to an Institutional Review Board (IRB) of the Tehran University of Medical Sciences Ethics Committee.
Acknowledgments
The data reported here have been supplied by the United Network for Organ Sharing (UNOS/OPTN) as the contractor for the Organ Procurement and Transplantation Network. We express our gratitude to the UNOS organisation for allowing access to the data. We would like to extend our sincere thanks to the Thoracic Research Center of the Tehran University of Medical Sciences (TUMS) for their support and cooperation during this research.
References
Footnotes
Contributors HA, MG, RS and MAG contributed to the conception and design of the study. MG and HA acquired the data. MG, HA, RS and MAG were involved in data interpretation and analysis. MG and HA drafted the manuscript. All authors critically revised the manuscript for important intellectual content and approved the final version to be published. HA is the guarantor.
Funding This research was funded by the Thoracic Research Center through Tehran University Medical Sciences by Grant Number (59042). The funding body played no role in the design of the study and collection, analysis, interpretation of data or manuscript writing .
Competing interests None declared.
Patient and public involvement Patients and/or the public were not involved in the design, or conduct, or reporting, or dissemination plans of this research.
Provenance and peer review Not commissioned; externally peer reviewed.
Supplemental material This content has been supplied by the author(s). It has not been vetted by BMJ Publishing Group Limited (BMJ) and may not have been peer-reviewed. Any opinions or recommendations discussed are solely those of the author(s) and are not endorsed by BMJ. BMJ disclaims all liability and responsibility arising from any reliance placed on the content. Where the content includes any translated material, BMJ does not warrant the accuracy and reliability of the translations (including but not limited to local regulations, clinical guidelines, terminology, drug names and drug dosages), and is not responsible for any error and/or omissions arising from translation and adaptation or otherwise.