Article Text

Abstract
Objective An elevated triglyceride-glucose (TyG) index positively correlates with adverse cardiovascular events. However, its association with myocardial injury after non-cardiac surgery (MINS) remains unclear. This study aimed to examine the association between the preoperative TyG index and MINS.
Design A cross-sectional study.
Setting Meizhou People’s Hospital.
Participants Adult patients under general anaesthesia and with MINS.
Main exposure measure The preoperative TyG index, calculated using triglyceride (TG) and fasting blood glucose (FBG) levels.
Main outcome measure The occurrence of MINS, defined using postoperative troponin measurements.
Results 889 patients were included, with an 8.3% incidence of MINS (74/889). The median TyG index was 8.57 (8.13, 9.02). TyG exhibited higher discriminatory ability for MINS than TG and FBG, with an area under the curve of 0.624, 0.544 and 0.500, respectively. Fully adjusted logistic regression indicated that an elevated TyG index was independently associated with MINS (OR 1.75, 95% CI 1.21 to 2.52; p=0.003). A multivariate restricted cubic spline suggested a linear relationship between TyG and MINS (p value for non-linearity=0.059). Subgroup analyses showed results consistent with the primary analysis, with no significant interaction effects between subgroups.
Conclusion An elevated preoperative TyG index is independently associated with an increased incidence of MINS. Monitoring the TyG index perioperatively may improve the management of patients at risk for MINS.
Trial registration number ChiCTR2400082834.
- Cardiovascular Disease
- General endocrinology
- Cardiology
- Adult anaesthesia
Data availability statement
Data are available upon reasonable request. The corresponding author can grant data access to this study upon request.
This is an open access article distributed in accordance with the Creative Commons Attribution Non Commercial (CC BY-NC 4.0) license, which permits others to distribute, remix, adapt, build upon this work non-commercially, and license their derivative works on different terms, provided the original work is properly cited, appropriate credit is given, any changes made indicated, and the use is non-commercial. See: http://creativecommons.org/licenses/by-nc/4.0/.
Statistics from Altmetric.com
STRENGTHS AND LIMITATIONS OF THIS STUDY
Postoperative troponin levels were used to diagnose myocardial injury after non-cardiac surgery (MINS) to enhance the diagnostic objectivity and accuracy.
We demonstrated a non-linear and independent association between the triglyceride-glucose (TyG) index and MINS through rigorous adjustment for multiple confounding variables overlooked in previous research.
This study enhances the applicability of the TyG index-MINS relationship across broader age demographics, while addressing a critical gap in previous research.
A causal relationship cannot be established between preoperative TyG and MINS due to the study design.
Introduction
Myocardial injury after non-cardiac surgery (MINS) occurs in approximately 3%–16% of surgical cases1–3 and is a significant cause of mortality within 30 days postoperatively.1 4 The pathophysiology of MINS includes the disruption of atherosclerotic coronary plaques and an imbalance between myocardial oxygen supply and demand. Preoperative coronary angiography is not mandatory for individuals with coronary artery disease (CAD) who do not exhibit apparent myocardial ischaemic symptoms, making it challenging to identify high-risk patients preoperatively. Therefore, clinicians need a convenient and practical index for this purpose. Significant risk factors for CAD include dyslipidaemia and hyperglycaemia. Both obesity5 and hyperglycaemia6 have been strongly associated with subclinical myocardial injury (SCeMI) and adverse cardiovascular events (ACEs).
The triglyceride-glucose (TyG) index, derived from triglycerides (TGs) and fasting blood glucose (FBG), has been linked to the severity of CAD and ACEs.7–10 Elevated TyG index levels are associated with increased severity of coronary artery stenosis and a higher number of diseased vessels in patients with acute coronary syndrome (ACS).11 12 The TyG index is a robust predictor of subclinical CAD, even without traditional cardiovascular risk factors (CVRFs).13 Furthermore, Kim et al demonstrated a correlation between higher TyG index levels and the presence of coronary artery calcification plaques in healthy adults.14 This observation suggests that patients indicated for operation who have a high TyG index and undergo general anaesthesia may possess underlying coronary artery atherosclerosis and a heightened risk of MINS, regardless of CVRFs. Since dyslipidaemia and hyperglycaemia are routinely detectable and modifiable preoperatively, understanding the relationship between MINS and the TyG index is crucial for perioperative management. However, there is limited research on this issue. Therefore, the clinical records from Meizhou People’s Hospital were reviewed to investigate whether preoperative TyG levels were associated with MINS. Elevated preoperative TyG index was hypothesised as an independent risk factor for developing MINS.
Methods and materials
Data source
This study used medical records from Meizhou People’s Hospital, including the electronic medical record system, surgical anaesthesia system, prescription system and laboratory and examination systems. The department of medical data and the department of medical administration granted access to these records. WC and FL were responsible for data extraction and cleaning, adhering to the study protocol.
Study population
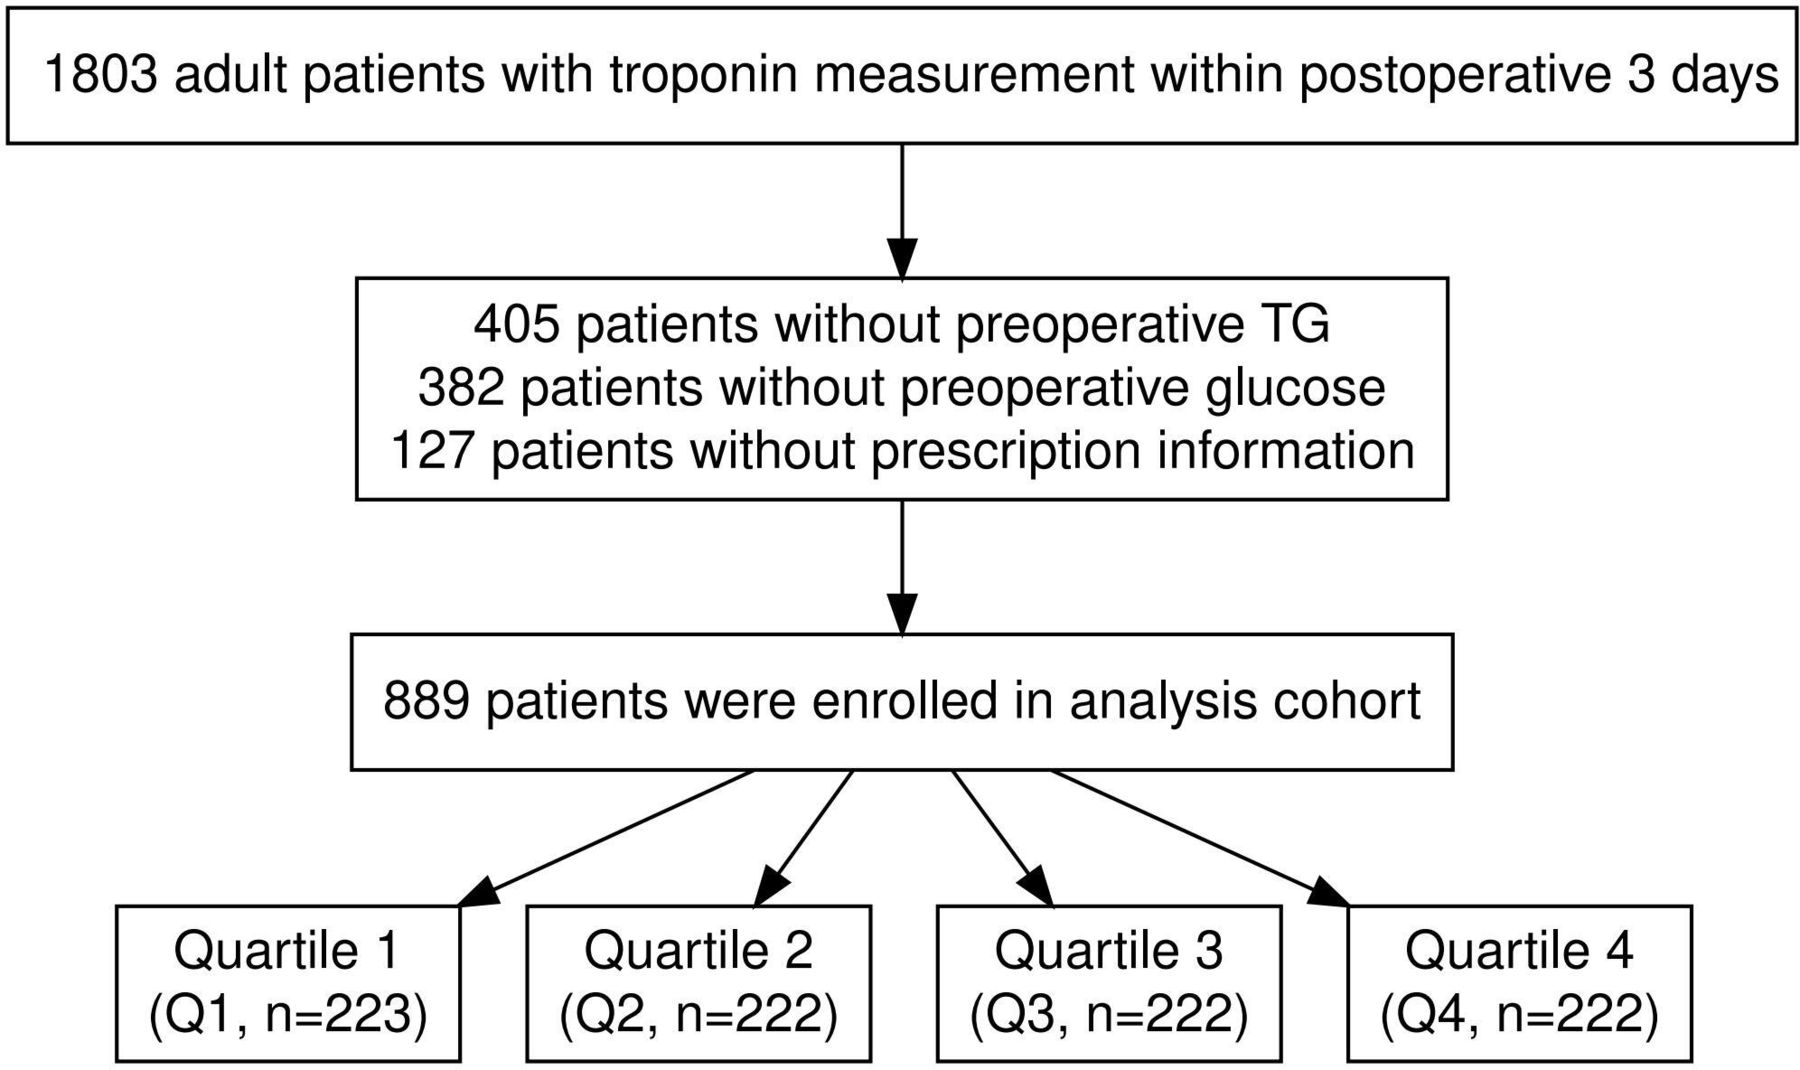
Inclusion criteria: patients indicated for operation aged ≥40 years, who were administered general anaesthesia and those with troponin measurements recorded within 3 postoperative days. Exclusion criteria: (1) patients <40 years; (2) patients admitted without FBG and TG measurements; (3) patients lacking prescription information.
Exposure of interest
The primary exposure was the preoperative TyG index, calculated using the formula: TyG=ln (TG (mg/dL)×FBG (mg/dL)/2).15 16 The conversion formulae used were FBG (mg/dL)=FBG (mmol/L)×18.0 and TG (mg/dL)=TG (mmol/L)×88.6. If FBG and TG were measured multiple times preoperatively, the closest measurements to the operation time were used.
Variables
The potential variables were categorised into four groups: (1) demographic characteristics, including age, gender and body mass index (BMI); (2) preoperative comorbidities, including congestive heart failure, hypertension, CAD, chronic obstructive pulmonary disease (COPD), diabetes, history of stroke and peripheral vascular disease (PVD); (3) preoperative laboratory results, including haemoglobin and estimated glomerular filtration rate (eGFR); (4) surgical information, including the American Society of Anesthesiologists Physical Status Classification System, highest intraoperative heart rate to mean arterial pressure, duration of anaesthesia and surgical categories.
Outcomes
The outcome of interest was MINS, defined by postoperative troponin levels exceeding the 99th percentile upper reference limit without non-ischaemic causes.17 18
Statistical analysis
This study included as many individuals as possible; therefore, no power calculation was conducted. The random forest algorithm was used for multiple imputations of variables with <20% missing data. Variables with >20% missing data were excluded to avoid bias. Patients were categorised into four groups based on the TyG index quartiles. Categorical variables were expressed as proportions. χ2 test and Fisher’s exact test were used for unordered categorical variables and Kruskal-Wallis tests for ordered categorical variables. Continuous variables, expressed as median (IQR) due to non-normal distribution (per Shapiro-Wilk test), were analysed using the Mann-Whitney U test or Kruskal-Wallis rank sum tests. The diagnostic performance of TyG for MINS was assessed using receiver operating characteristic (ROC) curves to determine the best cut-off value. Logistic regression analysis identified factors influencing MINS across three models. Model 1: unadjusted; Model 2: adjusted for variables with a p value <0.2 in the univariate analysis, along with clinically relevant variables; Model 3: adjusted for all predefined variables. OR and 95% CI were calculated for TyG and the outcome. The linear trend (p value trend) was assessed, and a multivariate restricted cubic spline (RCS) model analysed the non-linear relationship between baseline TyG and MINS. Post-hoc subgroup analyses were stratified by age (≤69 years and >69 years), gender, BMI (<25 kg/m2 and ≥25 kg/m2), hypertension and surgical category, with interaction effects tested between subgroups.
A p value <0.05 indicated statistical significance in two-tailed tests. Based on the open-source R, all statistical analyses were conducted using Stata software (https://www.mstata.com/).
Patient and public involvement
This study did not involve members of the public or patients.
Results
Reporting guideline
This study adheres to the Strengthening the Reporting of Observational Studies in Epidemiology guidelines.19
Patient characteristics
A total of 889 patients undergoing general anaesthesia were included in the study (figure 1). Patients were categorised into four groups based on their TyG index (table 1). The TyG ranges for each group are specified in table 1. More than half of the patients were men, with a median age of 64 years. The overall median TyG index for all patients was 8.57, and the incidence of MINS was 8.3%. The fourth quartile (Q4) group generally exhibited a higher BMI and a higher prevalence of preoperative hypertension, diabetes and history of stroke. Patients with a lower TyG index exhibited a lower incidence of MINS than those with a higher TyG index (p=0.009).
Baseline characteristics for patients stratified by TyG index quartiles

Flowchart of the study population. Flow diagram illustrating the inclusion and exclusion of cases. TG, triglyceride.
Baseline characteristics of patients with and without MINS
Online supplemental table S1 details the differences between the MINS and non-MINS groups. The median TyG index was significantly higher in the MINS group than in the non-MINS group (p<0.001). The two groups significantly differed in preoperative eGFR (p=0.002). Moreover, the MINS group exhibited a significantly higher occurrence of COPD, a history of stroke and PVD. Preoperative statin use was significantly lower in the non-MINS group (p=0.027).
Supplemental material
ROC analysis
The TyG index demonstrated higher discriminatory accuracy for MINS than TG and FBG, with an area under the curve of 0.624, 0.544 and 0.500, respectively (online supplemental figure S1). The optimal cut-off value for the TyG index was identified as 8.73 (63.2% specificity and 60.8% sensitivity).
Multivariable logistic regression
The continuous TyG index was positively associated with MINS in the crude and adjusted models (table 2). Neither the Q2 nor the Q3 group exhibited a significantly different risk of MINS than the Q1 group. However, the Q4 group exhibited a substantially increased risk of MINS across all models. A significant linear (p value) trend was observed across Models 1, 2 and 3.
Univariate and multivariate logistic regression for TyG index and MINS
RCS analysis
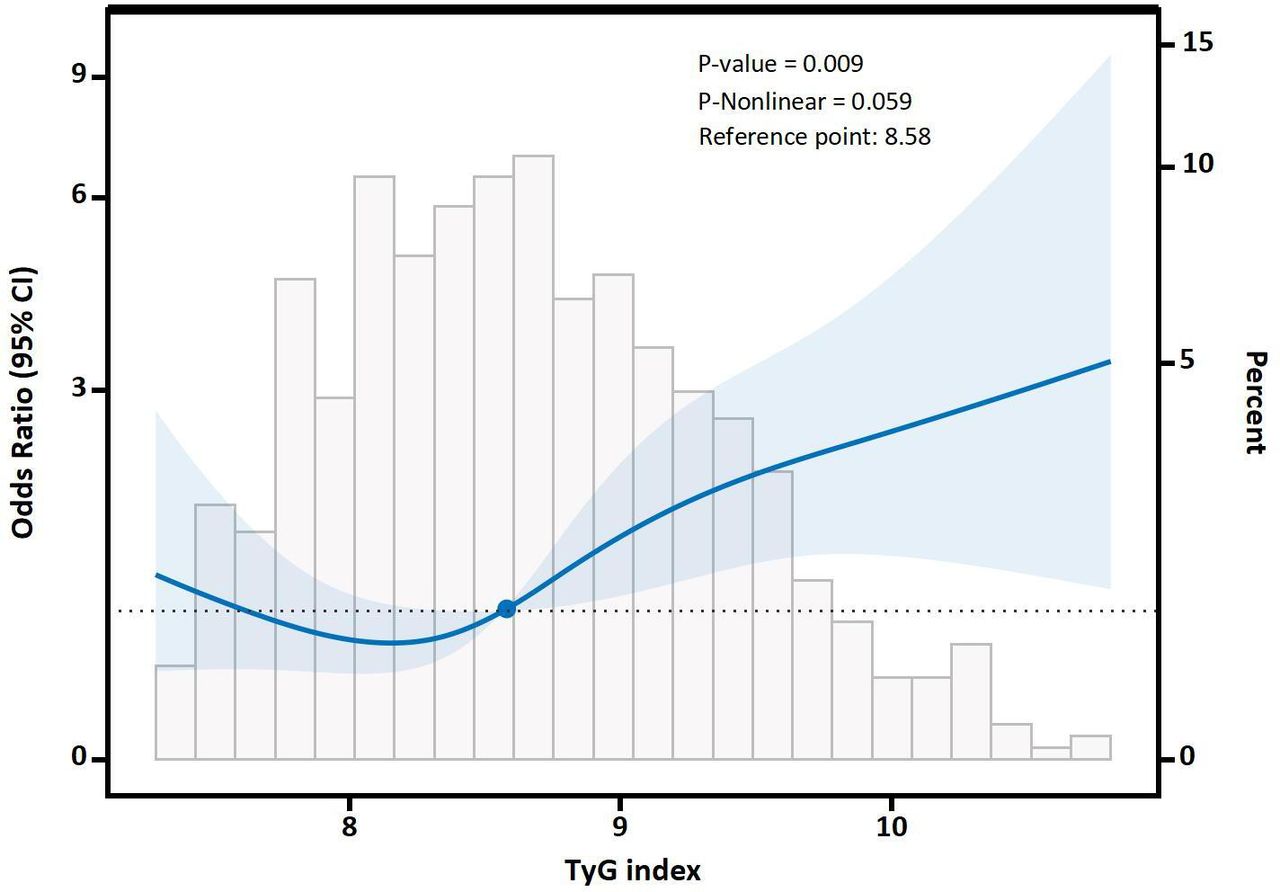
The RCS analysis revealed a linear increase in the risk of MINS with rising TyG index values (p value for non-linearity=0.059) (figure 2). The reference point was set at 8.58, consistent with the optimal cut-off value of 8.73 derived from the ROC analysis.

RCS of TyG and MINS. The central thick blue line represents the adjusted OR, with shaded bands indicating the 95% CI. The horizontal dotted line represents an OR of 1.0. The solid blue dot indicates the reference point for the TyG index (8.58). The ORs were adjusted for age, gender, CAD, COPD, stroke, PVD, rate-controlling medications, statins and eGFR. CAD, coronary artery disease; COPD, chronic obstructive pulmonary disease; eGFR, estimated glomerular filtration rate; MINS, myocardial injury after non-cardiac surgery; PVD, peripheral vascular disease; RCS, restricted cubic spline; TyG index, triglyceride-glucose index.
Subgroup analysis
For clinical application, patients were categorised into two groups based on the TyG index (≤8.73 vs >8.73) to examine subgroup heterogeneity (figure 3). A TyG index >8.73 was particularly prominent in the following subgroups: patients ≤69 years, female patients, patients with a BMI <25 kg/m², patients without hypertension and patients undergoing non-thoracic surgery. There was no considerable interaction effect among these subgroups.

Post-hoc subgroup analysis. Forest plots depicting the relationship between the TyG index (≤8.73 and >8.73) and MINS. The ORs were adjusted for age, gender, CAD, COPD, stroke, PVD, rate-controlling medications, statins and eGFR. *No of events/total no. (%). CAD, coronary artery disease; COPD, chronic obstructive pulmonary disease; eGFR, estimated glomerular filtration rate; MINS, myocardial injury after non-cardiac surgery; PVD, peripheral vascular disease; TyG index, triglyceride-glucose index.
Discussion
This study reveals that an elevated preoperative TyG index is independently associated with MINS. Our research provides a novel perspective for risk stratification and management strategies related to MINS. Previous research on the relationship between the preoperative TyG index and postoperative ACEs has been limited.
The TyG index demonstrates greater clinical utility than the homeostasis model assessment of insulin resistance (HOMA-IR) for evaluating insulin resistance (IR) and predicting metabolic disease risk.20 Its key advantage lies in operational efficiency: HOMA-IR requires fasting insulin measurements, which are often unavailable in low-resource settings, thereby limiting its clinical accessibility. In contrast, the TyG index can be calculated using two routinely measured preoperative parameters—TG and FBG. Recent studies have confirmed a significant positive association between elevated TyG index and several cardiovascular disorders,21 including heart failure,22 ACS and CAD,9 23 arterial stiffness,24 stroke,25 26 ACEs27 and atrial fibrillation.28 However, the relationship between the preoperative TyG index and MINS remains ambiguous. According to Liu et al, the TyG index is a significant biomarker of SCeMI.29 Similarly, our study demonstrates a correlation between an elevated preoperative TyG index and a greater risk of MINS, complementing these findings. Compared with FBG and TG, the TyG index demonstrates more robust diagnostic efficacy for MINS, possibly because it more comprehensively reflects the body’s metabolic status and arterial disease state. The linear association between the preoperative TyG index and MINS suggests that the TyG index could be used to predict the incidence of MINS in patients indicated for operation. Consistent with previous studies,29 30 a high TyG index is associated with MINS, even among patients without diabetes and with normal BMI. However, subgroup analysis suggests that the predictive value of the TyG index is weakened in patients with obesity, diabetes and hypertension. These results may be attributed to differences in population characteristics and disease states, including cardiovascular system damage caused by hyperlipidaemia, diabetes and hypertension, and the interference of therapeutic drugs (statins, antidiabetics and antihypertensive drugs). Complex disease states may limit the predictive ability of the TyG index. In high-risk patients, individualised risk assessment requires a combination of multiple indicators to improve predictive accuracy.
Emerging evidence aligns with our findings, demonstrating that the atherogenic index of plasma (AIP) independently predicts MINS.31 These investigations synergistically highlight the clinical utility of preoperative metabolic profiling for stratifying postoperative ACEs. While the AIP study focused specifically on the TG-to-high density lipoprotein ratio as a lipid-centric predictor, our TyG index analysis extends this paradigm by evaluating the combined contribution of TG and glucose metabolism to perioperative cardiovascular risk. This complementary approach strengthens the rationale for incorporating multidimensional metabolic assessments into preoperative evaluation of postoperative ACEs. Our findings not only validate the TyG index’s predictive capacity but crucially extend its clinical application through population diversification. Our results align with prior evidence demonstrating the TyG index’s association with MINS in geriatric populations (≥65 years).32 Notably, our investigation extends beyond this demographic by encompassing younger surgical patients (≥40 years), thereby broadening the validated clinical applicability of the TyG index across age groups under-represented in existing MINS research. This expanded patient spectrum addresses a critical knowledge gap, as current studies predominantly focus on elderly populations despite the growing prevalence of CVRFs in younger adults.1 17 33 Moreover, our study advances the field by establishing a linear dose-response relationship between TyG index values and MINS risk—a finding not previously quantified in earlier investigations. These methodological refinements strengthen the TyG index’s utility for preoperative risk stratification in diverse surgical populations.
The association between the TyG index and MINS can be explained through atherosclerosis and metabolic abnormalities. The TyG index is a biomarker of metabolic disorders and atherosclerotic and cardiovascular diseases.16 34 35 It reflects the degree of CAD and is independently associated with coronary atherosclerosis in healthy adult populations.9 14 The TyG index is closely associated with IR.36–39 IR leads to endothelial dysfunction, increased inflammatory responses, accelerated foam cell formation and smooth muscle cell proliferation, which promote atherosclerosis and vascular plaque formation.40 41 Moreover, IR may reflect platelet reactivity and endothelial-dependent vasodilation.42 An elevated preoperative TyG index is associated with hypertension, hyperglycaemia and hyperlipidaemia, all of which enhance the risk of vascular inflammation, coagulation and atherosclerosis. These mechanisms contribute to SCeMI.29 Perioperative haemodynamic changes, inflammatory responses and oxidative stress may exacerbate pre-existing SCeMI, leading to MINS. Further investigations are needed to elucidate the exact mechanisms associating an elevated TyG index with MINS.
This study highlights the clinical utility of the preoperative TyG index as a simple, cost-effective tool for identifying patients at elevated risk of MINS. Preoperative troponin testing is not routine unless patients have a known history of CAD or exhibit symptoms of myocardial ischaemia. The TyG index, more accessible than preoperative troponin, could serve as an alternative screening tool. It is associated with CAD severity, subclinical CAD, SCeMI and MINS. Clinicians should consider incorporating TyG index screening into preoperative assessments for patients aged ≥40 years undergoing general anaesthesia, particularly those without overt cardiovascular symptoms. A high TyG index could be helpful for preoperative assessments, including preoperative myocardial status evaluation and guidance for intervention strategies (eg, glycaemic control and lipid management). For patients with a preoperative TyG index >8.73, heightened vigilance is warranted, including troponin testing, coronary angiography and medical therapy (such as statins and aspirin), especially for those without a clear CAD history. Our findings suggest that preoperative TyG index evaluation could refine perioperative risk stratification and guide targeted interventions to mitigate MINS-related complications. Randomised controlled trials (RCTs) are necessary to verify the optimal strategies based on the preoperative TyG index evaluation.
Limitations
This study has several limitations. First, residual confounding factors may have introduced bias, such as excluding patients <40 years old and those lacking preoperative FBG and TG measurements. Second, preoperative troponin screening was not performed for all patients indicated for surgery, potentially missing those with preoperative myocardial injury and introducing selection bias. This study limited its troponin measurements to patients with myocardial ischaemia symptoms. Since asymptomatic myocardial injury is prevalent among postoperative patients, our study may not fully capture the potential association between the preoperative TyG index and asymptomatic myocardial injury. Current guidelines recommend troponin measurements (Class I recommendation) for patients who develop myocardial ischaemia symptoms following non-cardiac surgeries. For those at high risk but without postoperative ischaemic signs, a Class IIb recommendation is given.43 The high rate of missing glycated haemoglobin (HbA1c) data led to its exclusion from the primary analysis. However, multivariate logistic regression analysis on the subset of data containing HbA1c yielded results consistent with the primary analysis (online supplemental table S2). Third, our study focused solely on the association between baseline TyG index and MINS. Future RCTs are essential to determine the impact of variations in the TyG index on MINS prevention, mainly through preoperative interventions targeting lipid and glucose levels.
Conclusion
An elevated preoperative TyG index is positively associated with a higher incidence of MINS. It can be used to assess the risk of MINS preoperatively. Further research is required to determine if controlling and monitoring the TyG index can reduce postoperative ACEs.
Data availability statement
Data are available upon reasonable request. The corresponding author can grant data access to this study upon request.
Ethics statements
Patient consent for publication
Ethics approval
The Ethical Review Board of Meizhou People's Hospital reviewed the study protocol and approved this study, and informed consent was not required (Ethic No. 2023-C-92). We have also registered this study at the Chinese Clinical Trial Registry (No. ChiCTR2400082834).
References
Footnotes
Contributors YZ: study design, data collection and examination, data analysis, manuscript drafting and manuscript revision; WC and FL: data examination and analysis, manuscript drafting and manuscript revision; LZ: data examination and data analysis; YL: data examination and analysis, supervision of the study process and manuscript revision; YZ (guarantor): study design, data collection, examination, data analysis, manuscript drafting, manuscript revision and supervision of the study process.
Funding The authors have not declared a specific grant for this research from any funding agency in the public, commercial or not-for-profit sectors.
Competing interests None declared.
Patient and public involvement Patients and/or the public were not involved in the design, conduct, reporting or dissemination plans of this research.
Provenance and peer review Not commissioned; externally peer reviewed.
Supplemental material This content has been supplied by the author(s). It has not been vetted by BMJ Publishing Group Limited (BMJ) and may not have been peer-reviewed. Any opinions or recommendations discussed are solely those of the author(s) and are not endorsed by BMJ. BMJ disclaims all liability and responsibility arising from any reliance placed on the content. Where the content includes any translated material, BMJ does not warrant the accuracy and reliability of the translations (including but not limited to local regulations, clinical guidelines, terminology, drug names and drug dosages), and is not responsible for any error and/or omissions arising from translation and adaptation or otherwise.