Article Text

Abstract
Objective This study examines the risk factors associated with non-communicable diseases (NCDs), specifically diabetes mellitus (DM) and hypertension (HTN), among adults in Bangladesh, a lower-middle-income country. Given the rising prevalence of DM and HTN and their significant public health burden, this research aims to identify key socioeconomic, demographic and lifestyle-related determinants to inform targeted interventions.
Design The study used nationally representative cross-sectional data extracted from the Bangladesh Demographic and Health Survey conducted in 2017–2018.
Setting Bangladesh.
Participants The study included 8013 women and 6691 men aged 18 and older who were eligible for blood pressure and blood glucose measurements.
Primary outcomes Type 2 DM, HTN.
Results HTN was significantly associated with higher odds of diabetes (adjusted OR (AOR)=1.28, 95% CI: 1.14 to 1.43), while diabetes was associated with increased odds of HTN (AOR=1.24, 95% CI: 1.11 to 1.39). Individuals aged 40 years and older had 74.8% higher odds of diabetes (AOR=1.748, 95% CI: 1.58 to 1.993) and were 3.21 times more likely to have HTN (AOR=4.208, 95% CI: 3.781 to 4.685). Overweight individuals had 2.15 times higher odds of HTN compared with those with normal weight (AOR=2.154, 95% CI: 1.98 to 2.34). Wealthier individuals also showed significantly higher odds of both DM and HTN.
Conclusions This study highlights the strong association between DM and HTN and identifies age, overweight status and higher socioeconomic class as key risk factors. These findings underscore the need for integrated public health strategies targeting NCD prevention and management in Bangladesh. Further research should explore longitudinal trends and the impact of targeted interventions on reducing the burden of NCDs.
- Hypertension
- PUBLIC HEALTH
- DIABETES & ENDOCRINOLOGY
- Blood Pressure
- Cardiovascular Disease
Data availability statement
Data are available in a public, open access repository. All data relevant to the study are available online and given on request (https://dhsprogram.com/data).
This is an open access article distributed in accordance with the Creative Commons Attribution Non Commercial (CC BY-NC 4.0) license, which permits others to distribute, remix, adapt, build upon this work non-commercially, and license their derivative works on different terms, provided the original work is properly cited, appropriate credit is given, any changes made indicated, and the use is non-commercial. See: http://creativecommons.org/licenses/by-nc/4.0/.
Statistics from Altmetric.com
STRENGTHS AND LIMITATIONS OF THIS STUDY
Utilisation of a comprehensive nationwide survey.
First to implement a mixed-effects model for this dataset in Bangladesh.
Unique findings regarding geographical and educational disparities with hypertension.
Findings highlight the role of lifestyle and socioeconomic factors in driving non-communicable disease prevalence.
Exclusion of variables (genetics, family history and lifestyle factors) due to data unavailability.
Background
World situation of diabetes mellitus and hypertension
Non-communicable diseases (NCDs) are responsible for 71% of all deaths worldwide, killing 41 million people each year—more than all other causes combined.1 In 2019, NCDs accounted for 74% of all global deaths and comprised 7 of the top 10 leading causes of mortality.2 Alarmingly, 15 million people aged 30–69 years die prematurely from NCDs annually, with 85% of these deaths occurring in low-income and middle-income countries (LMICs).1
NCDs affect individuals across all stages of life, from infancy to old age and pose a significant threat to public health, economic stability and social development.3 Recent publications from the Lancet Taskforce on NCDs and Economics highlight the strong link between economic development and NCD management, emphasising how poverty exacerbates the burden of NCDs.4–8 The financial strain of NCDs on healthcare systems and national welfare is substantial and is expected to grow in the coming years.9
By 2030, NCD-related deaths are projected to rise from 41 million to 52 million, threatening the achievement of Sustainable Development Goal (SDG) target 3.4, which aims to reduce premature NCD mortality by one-third through prevention and treatment.10–12 While developed countries have made progress in addressing NCDs, LMICs continue to face significant challenges due to underlying risk factors.
The WHO identifies four major global risk factors for NCDs: tobacco use, physical inactivity, harmful alcohol use and unhealthy diets.13 These factors contribute to four key metabolic changes: elevated blood pressure (hypertension, HTN), obesity, elevated blood glucose (hyperglycaemia) and elevated blood lipids (hyperlipidaemia).1 14
Diabetes mellitus (DM) is a leading contributor to NCD-related mortality, claiming one life every 5 s.15 In 2017, an estimated 451 million adults aged 18–99 lived with diabetes, a number projected to rise to 693 million by 2045.16 Alarmingly, 49.7% of diabetic patients remain undiagnosed.17 LMICs bear 80% of the global diabetes burden, with most cases undiagnosed for years.18 In 2019, diabetes directly caused 1.5 million deaths, ranking as the ninth leading cause of mortality worldwide.19 By 2030, diabetes prevalence in South Asia is expected to increase by over 150%, posing a major public health challenge.20
HTN, often termed a ‘silent killer’, is another leading cause of premature deaths worldwide.21 It is responsible for 9.4 million deaths annually, comparable to the mortality burden of infectious diseases.22 By 2025, the global prevalence of HTN is projected to increase by 60%, affecting 1.56 billion people.23 Contrary to popular belief, two-thirds of the global HTN burden are borne by LMICs.21 24 South Asian countries, including those in the SAARC (South Asian Association for Regional Cooperation) region, have HTN prevalence rates exceeding the global average.25
The development of NCDs is influenced by a complex interplay of socioeconomic, sociodemographic and lifestyle-related factors.26–29 Rising body mass index (BMI) levels, linked to increased diabetes risk, are a significant concern in both urban and rural populations.30–32 Interestingly, recent evidence suggests an inverted U-shaped relationship between socioeconomic status (SES) and the prevalence of DM and HTN.33 Smoking, another critical risk factor, increases the likelihood of type 2 DM (T2DM), with heavy smokers facing the highest risk. The elevated risk persists for up to 10 years after smoking cessation, declining more rapidly for lighter smokers.34–36 While gender has long been considered a relevant covariate, media exposure appears to have minimal influence on NCD prevalence.37
Situation in Bangladesh
As an LMIC, Bangladesh faces a significant NCD burden, with NCDs accounting for 59% of total deaths—approximately 886 000 deaths annually.38 39 A systematic review and meta-analysis estimated the national diabetes prevalence at 7.8% (95% CI: 6.4% to 9.3%).40 According to the WHO, diabetes affects 12.88 million people (8% of the population) in Bangladesh and is responsible for 3% of all deaths.41 HTN is also a growing concern, with recent studies reporting a prevalence of 20% in Bangladesh.21 42
In Bangladesh, the prevalence of T2DM is increasing in both urban and rural areas.43 While alcohol consumption is limited due to religious restrictions, other risk factors such as tobacco use, physical inactivity and unhealthy diets are on the rise.14 44 Geographical studies have identified age, education level and SES as key determinants of HTN and T2DM, with notable regional disparities.45 46 Existing research has identified several covariates associated with the high prevalence of DM and HTN in Bangladesh, including gender, older age, higher education, greater wealth, elevated BMI, unemployment, urban residence and smoking.47–50
Focus of the research
The growing prevalence of DM, HTN and other NCDs has prompted urgent calls for action to improve healthcare and well-being.20 51–54 In response to the growing NCD burden, the WHO has supported the Bangladeshi government in developing a multisectoral action plan for NCD prevention and control (2018–2025), involving approximately 30 ministries and organisations. Identifying potential risk factors for DM and HTN is critical for implementing targeted public health interventions and allocating resources effectively.55 The 2011 Bangladesh Demographic and Health Survey (BDHS) was the first nationwide study to measure fasting blood glucose (FBG) and blood pressure, establishing a direct relationship between these factors and NCDs.56 However, the data are now outdated, and Bangladesh lacks a comprehensive study using the recent data sources, such as the BDHS 2017–2018.
This study aims to determine the sociodemographic, socioeconomic and lifestyle-related factors influencing the prevalence of DM and HTN in Bangladesh. By leveraging the nationally representative survey data, we hope to provide evidence-based insights to policy-makers, enabling them to prioritise actions and mitigate the financial and social strain of NCDs, ultimately contributing to the achievement of SDG targets.
Methods
Data source
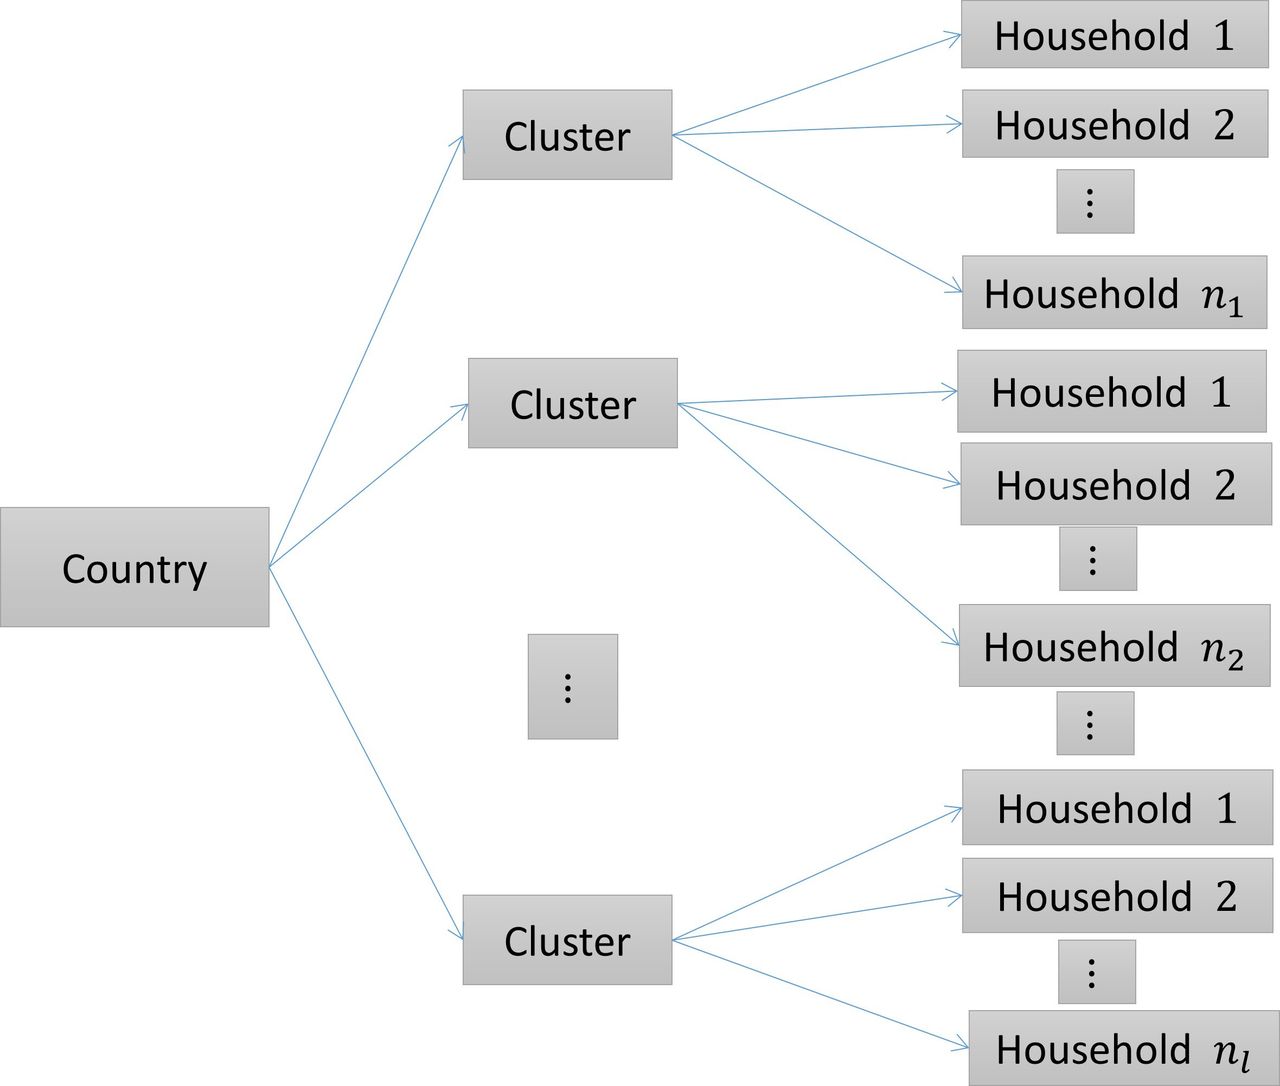
The research used secondary data obtained from the 2017–2018 BDHS, which is a survey conducted on a nationally representative sample.57 The 2017–2018 BDHS was carried out by the National Institute of Population Research and Training under the auspices of the Ministry of Health and Family Welfare of Bangladesh, as a component of the broader Demographic and Health Survey (DHS) programme. The 2017–2018 BDHS employed a two-stage stratified cluster sampling design, and sampling weights were computed by considering the sampling probabilities at each stage and for every cluster. The survey’s primary sampling unit (PSU) consists of enumeration areas (EAs) that typically encompass an average of approximately 120 homes. In the initial phase, a total of 675 PSUs were chosen from a list of 293 579 PSUs generated by the Bangladesh Bureau of Statistics (BBS). The selection of these PSUs was based on a probability proportionate to the size of the EAs. During the second stage of sampling, a systematic sampling method was employed to choose a total of 30 families from each of the chosen PSUs.
This study uses data from the biomarker questionnaire, which is one of the five types of questionnaires employed in the BDHS conducted in 2017–2018. The 2017–2018 BDHS is the second iteration of the survey that includes the collection of blood pressure and FBG biomarker readings. During the 2017–2018 Behavioural Risk Factor Surveillance System, data pertaining to biomarkers and pertinent demographic information were gathered from a representative sample of individuals aged 18 and above, residing in one-quarter of the homes chosen for the survey. The collection of biomarkers was undertaken to get appropriate national data regarding the prevalence of HTN (ie, raised blood pressure) and diabetes (ie, raised blood glucose). Data regarding the management of HTN and diabetes were also gathered. The International Classification of Functioning, Disability and Health (ICF), in collaboration with local experts, provided support in the formulation of the biomarker testing procedure.
Sample
In the BDHS 2017–2018, data concerning biomarkers and relevant demographic information were gathered from a representative sample of individuals aged 18 and above, residing in one-quarter of the household chosen for participation in the survey. A total of 8013 females and 6691 males, all aged 18 years and above, met the criteria for inclusion for the assessment of blood pressure and blood glucose levels. Within the surveyed population, it was found that 93% of women and 85% of men underwent blood pressure assessment, whereas 87% of women and 79% of men underwent blood glucose testing. 2438 and 1575 missing values for FBG and both systolic blood pressure (SBP) and diastolic blood pressure (DBP) measurement respectively were discarded due to unavailability of information.
Outcome variable
This study encompasses two primary dependent variables: the presence or absence of diabetes and the presence or absence of HTN. Individuals were classified as having elevated blood glucose or diabetes if their FBG exceeded a threshold of 6 mmol/L.1 2 Otherwise, they were regarded as being in a normal health status or non-diabetic. Participants were categorised as having HTN if, during the survey, their mean SBP exceeded 140 mm Hg or their mean DBP exceeded 90 mm Hg. The categorisation process involved adhering to the recommendations provided by the WHO and conducting a comprehensive evaluation of relevant literature.
Explanatory variables
The selection of explanatory variables is informed by a comprehensive evaluation of relevant literature. These variables are further categorised into demographic, biomedical and behavioural aspects.
The demographic factors considered in this study include age (categorised as ≤40 years and >40 years), gender (classified as female and male), division of residence (Barisal, Chittagong, Dhaka, Khulna, Mymensingh, Rajshahi, Rangpur and Sylhet), type of residence (categorised as rural and urban), education level (ranging from no education to primary, secondary and higher education) and wealth index (categorised as poorest, poorer, middle, richer and richest).
Biomedical variables encompass BMI categories, including thin (BMI<18.5 kg/m2), normal (BMI 18.5–24.9 kg/m2) and overweight (BMI>24.9 kg/m2), as well as the presence of HTN and diabetes. Diabetes is recognised as a contributing factor to the development of HTN, while HTN is similarly acknowledged as a contributing factor to the development of diabetes.
The behavioural characteristics under consideration include smoking status (yes/no), engagement in physical activity or employment (yes/no) and exposure to media (yes/no). An individual is considered to have media exposure if they engage in activities such as reading newspapers or magazines, listening to the radio, or watching television at least once a week.
Patient and public involvement
This study did not directly involve patients or the public in its design or conduct. The analysis used secondary data from the 2017–2018 BDHS, which are publicly available and based on the MEASURE DHS model questionnaires. This nationally representative survey was conducted across all eight administrative divisions of Bangladesh, primarily focusing on women of reproductive age.
Why use mixed model
Figure 1 shows how the survey has been designed, and it led us to the fact that the objective is not only limited to showing the factors of DM and HTN but also to accommodate the clustering effect. A mixed model is required for incorporating the repercussions of the clustering under consideration. To satisfy the intention to encapsulate the clustering effect, in this investigation, a mixed-effect logistic regression model was employed as a methodological approach to effectively account for the intricate cluster effects pertaining to the phenomenon of DM and HTN. Through the assessment of intracluster correlation (ICC) coefficients, we have ascertained the presence or absence of cluster variation within the dataset employed in the present study.

Survey structure.
Statistical analysis
In the context of univariate analysis, the frequency distribution of each category within the selected variables is presented to illustrate the data patterns across several components. Frequency distributions are used to provide a descriptive analysis of the attributes or traits exhibited by the participants or respondents.
In order to investigate the association between several factors and the presence of diabetes and HTN, a bivariate analysis was undertaken, accompanied by the utilisation of the χ2 test. Contingency tables have been used to investigate the distribution of diabetes and HTN among individuals, as well as their relationship with explanatory variables. The χ2 test is conducted to determine the presence of a connection between the presence of diabetes and HTN while considering unadjusted possible confounders. This analysis is performed on contingency tables where all expected cell frequencies are more than 5.
To explicitly characterise a diverse range of cluster fluctuations, the authors employed generalised linear mixed models (GLMMs). The adjusted ORs (AORs) of the covariates were obtained from the mixed-effect logistic regression model. Let,  be
be  individual/household from
  cluster where
  and
and  ; let,
  be a vector of covariates for
  household from
  cluster related with fixed effect parameter
β
.
u
represents a
cluster related with fixed effect parameter
β
.
u
represents a  vector of random effects corresponding to
q
clusters and
vector of random effects corresponding to
q
clusters and  is a special vector of size
  which contains all zeros but a 1 at the
  position;
 . Here,
  , where
  be the random effect of cluster
l
. Under GLMM, the linear predictor takes the form,
be the random effect of cluster
l
. Under GLMM, the linear predictor takes the form,  . Using the logit link function in GLMM,58

In this study, only random intercepts have been considered,  , where,
  . Therefore, the general conditional probability of
  household from
  cluster given the value of the explanatory variable of that observation and the random effect of that cluster is,

The likelihood function for the individuals corresponding to  cluster is,

The estimates are obtained by maximising the following marginal likelihood function,

The formula of ICC coefficient is  .59
.59
Results
Univariate analysis
We started our analysis by tabulating the frequencies of the variables of interest as shown in table 1. The study population comprised 54.5% males and 44.5% females. Approximately 60% of participants were aged 40 years or younger, while the remaining 40% were older than 40 years. In terms of BMI, 58.2% of respondents fell within the normal range, whereas 17.1% were classified as thin and 24.7% as overweight. Regarding educational attainment, 25.3% of participants had no formal education, while 29.5%, 28.5% and 16.7% had completed primary, secondary and higher education, respectively. A majority of respondents (62.5%) resided in rural areas. Geographically, participants were distributed across divisions as follows: Dhaka (14.7%), Barisal (10.5%), Chittagong (14.1%), Khulna (13.3%), Rajshahi (11.2%), Rangpur (12.5%) and Sylhet (12.0%). Media exposure was reported by nearly 80% of respondents, and 60% were currently employed. Smoking status was reported as ‘yes’ by 15.7% of participants. Wealth index distribution was relatively even, with approximately 20% of respondents in each category. The prevalence of diabetes and HTN among participants was 22% and 22.5%, respectively.
Background characteristics of the study population
Bivariate analysis
Diabetes
The χ2 test is performed to see the association between having diabetes and its covariates shown in table 2. Age, BMI, HTN, division, residence, wealth index, media exposure and working status have significant associations with having diabetes at a 1% level of significance. People are more likely to have diabetes in the age group greater than 40 years (27.1%) than in the age group 40 or less (18.6%). Diabetes is more prone as BMI increases, as most of the individuals (30.8%) in the overweight BMI category have diabetes. People having HTN are more likely to have diabetes (28.4%) than non-hypertensive patients (20.2%). Dhaka division has the most individuals with diabetes (36.5%) while Rangpur division has the least diabetic patients (14.8%). Urban people are a little bit more prone to have diabetes (23.1%) than rural people (22.2%). Rich people are more likely to have diabetes than poor people according to the percentage of diabetic individuals among the different wealth categories. Media-exposed people are more likely to have diabetes (23.3%) than people not exposed to media (17.5%), while currently working people are less prone to diabetes (20.4%) than not working people (24.5%). Sex, education and smoking status of the individuals were found to have an insignificant association with having diabetes.
The distribution of diabetes and hypertension by sociodemographic variables
Hypertension
The distribution of background characteristics by the levels of HTN is given in table 2.
Age, BMI, HTN, division, education, wealth index, media exposure, working status and smoking status have a significant association with having diabetes at a 1% level of significance. Like diabetes, people are more likely to have diabetes in the age group greater than 40 years (37.3%) than in the age group 40 or less (12.6%). HTN is more prone as BMI increases, as most of the individuals (32.9%) in the overweight BMI category have HTN. People having diabetes are more likely to have HTN (29.3%) than non-diabetic patients (20.9%). Unlike diabetes, the Dhaka division has the least individuals with HTN (18.6%) while the Rangpur division has the most hypertensive patients (26.6%). Exactly like in the case of diabetes, urban people are a little bit more prone to have HTN (23.1%) than rural people (22.2%). Education is negatively associated with, HTN as no educated people have the most hypertensive patients (29.5%) and it reduces as the level of education increases. Rich people are more likely to have HTN than poor people, as the percentage of hypertensive individuals increases with an increase in the wealth index. Media-exposed people are less likely to have HTN (21.5%) than people not exposed to media (26.3%). Also, currently working people are less prone to HTN (20.6%) than not-working people (25.4%). Smoking status has a positive association with, HTN as individuals who smoke are more likely to have HTN (26.9%) than individuals with no smoking habit (21.9%). Sex and residence were found to have an insignificant association with HTN.
Multivariate analysis
Diabetes
The variables that were found to have significant association with complications in bivariate analysis were further examined in a regression analysis for estimating the adjusted effects of these covariates. To determine the potential factors associated with the occurrence of diabetes, aORs obtained from the mixed-effect logistic regression model are given in table 3.
Adjusted OR (AOR), 95% CI and p value from mixed logistic regression model for diabetes
Individuals with HTN have 28.7% higher odds of having diabetes compared with those without HTN, as indicated by an AOR of 1.287 (95% CI: 1.149 to 1.442), which is statistically significant. Age is also a significant predictor, with individuals over 40 years having 74.8% higher odds of diabetes (AOR=1.748, 95% CI: 1.58 to 1.993) compared with those aged 40 or younger.
BMI plays a critical role, as overweight individuals have 45.5% higher odds of diabetes (AOR=1.455, 95% CI: 1.302 to 1.626) compared with those with normal weight. Conversely, individuals in the thin BMI category have 17.5% lower odds of diabetes (AOR=0.825, 95% CI: 0.717 to 0.95) relative to those with normal weight.
Geographical disparities are evident, with residents of Barisal, Chattogram, Khulna, Mymensingh, Rajshahi, Rangpur and Sylhet divisions having 35.9%, 45.6%, 64.4%, 52.5%, 63.2%, 68.5%, and 53.1% lower odds of diabetes, respectively, compared with those in the Dhaka division.
SES also influences diabetes risk. Individuals in the richer and richest wealth categories have 28.9% and 77.8% higher odds of diabetes, respectively, compared with those in the middle wealth category, with both findings significant at the 1% level.
Hypertension
aORs obtained by performing mixed-effect logistic regression have been shown in table 4 to find the risk factors associated with the occurrence of HTN.
Adjusted OR (AOR), 95% CI and p value from mixed logistic regression model for hypertension
Diabetic individuals have 24.4% higher odds of having HTN compared with non-diabetic individuals, as indicated by an AOR of 1.244 (95% CI: 1.112 to 1.391). Age is a significant predictor of HTN, with individuals over 40 years being 3.21 times more likely to have HTN (AOR=4.208, 95% CI: 3.781 to 4.685) than those aged 40 or younger.
Weight status also plays a critical role, as overweight individuals have 2.15 times higher odds of HTN (AOR=2.154) compared with those with normal weight. In contrast, individuals in the thin BMI category have 34.4% lower odds of HTN relative to those with normal weight.
Geographical disparities are evident, with residents of Barisal, Chattogram, Khulna, Rajshahi and Rangpur divisions having 61.7%, 27.7%, 38.1%, 57.2% and 92.7% higher odds of HTN, respectively, compared with those in the Dhaka division.
Educational attainment and SES also influence HTN risk. Moving from no education to secondary and higher education reduces the odds of HTN by 15.7% and 25.1%, respectively. Similarly, individuals in the poorer and poorest wealth categories have 15.8% and 22.4% lower odds of HTN, respectively, compared with those in the middle wealth category.
Media exposure is associated with an 18.9% reduction in the odds of HTN (AOR=0.811, 95% CI: 0.713 to 0.923), while working individuals are 17.8% less likely to have HTN compared with those who are not working.
Model selection
Both fixed and mixed-effect logistic regression models were applied to analyse the data. The Akaike information criterion values for the mixed-effect model were lower than those for the fixed effect model, with values of 11 760.5 (mixed) vs 11 968.43 (fixed) for diabetes and 11 382.79 (mixed) vs 11 409.46 (fixed) for HTN. The estimates of the variance component of the random effects were 0.38 and 0.126 for diabetes and HTN, respectively. The ICC coefficients derived from these estimates were 0.104 and 0.037, for the mixed-effect logistic models of diabetes and HTN, respectively, further supporting the use of a GLMM, as they highlight the presence of substantial variability across clusters. These results demonstrate that the mixed-effect logistic regression model provides a better fit to this type of clustered data compared with the traditional logistic model. Additionally, multicollinearity was assessed, and no significant multicollinearity was detected, as the variance inflation factor for all covariates was below the threshold of 5. All analyses were conducted using STATA V.15.
Discussion
This study identified key risk factors for DM and HTN among Bangladeshi adults using a mixed-effect modelling approach—the first of its kind in Bangladesh to account for cluster-level variability in nationally representative data. Our findings reveal critical insights into the relationship of demographic, biomedical and socioeconomic determinants of these NCDs. Below, we contextualise the results, compare them with existing literature and outline their implications.
Key findings and contextualisation
The mixed-effect logistic regression models demonstrated a bidirectional relationship between DM and HTN, with hypertensive individuals having 28.7% higher odds of DM (AOR=1.287) and diabetic individuals having 24.4% higher odds of HTN (AOR=1.244). This aligns with global evidence that DM and HTN share common pathways. Our findings underscore the need for integrated screening and management programmes in Bangladesh, where co-occurrence of these conditions intensifies morbidity and mortality.60 61
Age emerged as a dominant predictor, with individuals over 40 years having 74.8% higher odds of DM (AOR=1.748) and 3.21 times higher odds of HTN (AOR=4.208). These results corroborate studies highlighting the rising incidence of NCDs among ageing populations, since cumulative exposure to risk factors and reduced metabolic resilience drive disease progression.62 For instance, a systematic review of South Asian cohorts emphasised that ageing populations face escalating burdens of HTN and T2DM due to sedentary lifestyles and dietary shifts.25
BMI played a pivotal role, with overweight individuals exhibiting 45.5% higher odds of DM and 1.15 times higher odds of HTN. This mirrors findings from Bangladesh, where a BMI≥22.5 kg/m² significantly increased the risk of both conditions.63–65 Conversely, underweight individuals had lower odds, though this may reflect malnutrition-related complexities requiring further investigation.
Socioeconomic disparities revealed a dual burden. Wealthier individuals had 77.8% higher odds of DM (AOR=1.778), consistent with studies linking affluence to calorie-dense diets and sedentary habits.66 Conversely, poorer SES was significantly associated with HTN prevalence, likely due to stress, limited healthcare access and nutrient-poor diets.67 Notably, higher education reduced HTN odds by 25.1%, likely mediated by improved health literacy—a finding diverging from some regional studies but aligning with global evidence on education’s protective effects.
Geographical disparities were striking. Residents of Dhaka division faced the highest DM prevalence (36.5%), potentially linked to urbanisation and processed food consumption, while Rangpur division had the highest HTN burden (26.6%), the underlying drivers may include limited access to healthcare, socioeconomic stressors or regional dietary patterns. Notably, employment status and media exposure were associated with significantly reduced odds of HTN, with working individuals showing 17.8% lower odds (AOR=0.822) and media-exposed participants having 18.9% lower odds (AOR = 0.811). These findings align with prior research highlighting the protective role of occupational engagement and health information dissemination in mitigating HTN risk.68
Strengths and limitations
This study has several notable strengths. First, it uses nationally representative data from the 2017–2018 BDHS, ensuring that the findings are generalisable to the adult population of Bangladesh and other LMICs with similar socioeconomic and health profiles. Second, the diagnosis of diabetes and HTN was based on biomarker measurements (FBG and blood pressure), adhering to WHO guidelines, which minimises self-reporting bias and enhances the accuracy of disease classification. Third, the use of mixed-effect logistic regression models accounted for the hierarchical structure of the data, addressing cluster-level variability and reducing the risk of effect-size overestimation that can occur with conventional logistic regression. Additionally, the models were adjusted for a wide range of covariates, including demographic, socioeconomic and behavioural factors, providing a comprehensive assessment of risk factors.
However, this study is not without limitations. The cross-sectional design precludes the establishment of causal relationships, as the temporal sequence of exposure and outcome cannot be determined. While biomarker-based measurements reduce reporting bias, some covariates (eg, smoking status, media exposure) were self-reported, which may introduce recall or social desirability bias. Furthermore, the study could not be able to account for certain potential confounders, due to unavailability, such as race/ethnicity, dietary habits, genetic predisposition or family history of NCDs, which could influence the observed associations. Finally, the BDHS data do not include information on alcohol consumption or physical activity levels, limiting the scope of behavioural risk factor analysis.
To address these limitations, future research should employ longitudinal or cohort studies to establish causality and explore temporal trends in NCD risk factors. Qualitative studies could provide deeper insights into the behavioural and cultural drivers of diabetes and HTN in Bangladesh. Additionally, incorporating more granular data on diet, physical activity and genetic factors would enhance the robustness of risk factor analyses.
Conclusions
This study used leveraging nationally representative data and advanced mixed-effect modelling to identify critical risk factors for these conditions, offering evidence-based insights to guide interventions NCDs, particularly DM and HTN.
Findings reveal a bidirectional relationship between DM and HTN, with hypertensive individuals having 28.7% higher odds of DM and diabetic individuals having 24.4% higher odds of HTN. Age emerged as a dominant predictor, with individuals over 40 years facing significantly elevated risks.
Socioeconomic and geographical disparities further complicate the NCD landscape. Wealthier individuals exhibited higher odds of DM, likely due to sedentary lifestyles and calorie-dense diets, while poorer populations faced a disproportionate burden of HTN, driven by stress and limited healthcare access. Geographical variations were also evident, with higher odds of HTN in Rangpur and elevated odds of DM in Dhaka.
The study also underscores the protective role of education, employment and media exposure in reducing HTN risk. Furthermore, the persistence of high BMI as a major risk factor for both NCDs through dietary and lifestyle interventions.
Addressing the dual burden of DM and HTN in Bangladesh requires urgent, evidence-based action to achieve SDG 3.4. The time to act is now—failure to do so will only deepen the crisis, with profound implications for public health and economic stability.
Policy recommendations
To combat the rising tide of NCDs, Bangladesh must adopt a multisectoral approach that integrates healthcare, education and community engagement, including:
Early screening and detection: Lower the age threshold for NCD screening to 35+ years, particularly for women, to enable timely diagnosis and treatment, underscoring the need for targeted screening and preventive care. Notably, reducing the age threshold for screening from 40+ to 35+ years could enhance early detection and intervention, particularly for women, who are often underrepresented in NCD care.69
Targeted interventions: Develop region-specific programmes and interventions to address geographical disparities, such as salt-reduction campaigns in high-HTN areas and urban wellness initiatives in Dhaka.
Health literacy and awareness: Leverage media and educational institutions to promote healthy lifestyles and preventive behaviours. Health literacy programmes and awareness campaigns could be powerful tools for NCD prevention.
Promote healthy dietary habits: Increasing access to healthier food choices, ample supply of fresh foods, effective interpersonal communication on healthy diets, etc can be useful in resisting high BMI as a major risk factor for both diabetes and HTN.
Integrated care models: Establish dual-screening and management programmes for DM and HTN in primary healthcare settings to address their interconnected nature.
Data availability statement
Data are available in a public, open access repository. All data relevant to the study are available online and given on request (https://dhsprogram.com/data).
Ethics statements
Patient consent for publication
Ethics approval
This study did not involve the collection of new data from human participants. The data used were obtained from the Bangladesh Demographic and Health Survey (BDHS), which received ethical approval from the ICF Macro Institutional Review Board and the National Research Ethics Committee of the Bangladesh Medical Research Council. Prior to participation in the BDHS, written informed consent was obtained from all participants. Additionally, all identifying information was anonymised before the data were made publicly available.
Acknowledgments
The authors thank the DHS Programme for granting access to the BDHS 2017-18 data.
References
Footnotes
Contributors Conception and design: KSAN and TJ; Data curation and formal analysis: KSAN and TJ; Data interpretation: KSAN and TJ; Manuscript draft: KSAN; Reviewed and edited the final manuscript: KSAN and TJ. KSAN takes the responsibility of being the guarantor for the overall content of the manuscript. It was used to correct any grammatical mistakes in writing and for paraphrasing.
Funding The authors have not declared a specific grant for this research from any funding agency in the public, commercial or not-for-profit sectors.
Competing interests None declared.
Patient and public involvement Patients and/or the public were not involved in the design, or conduct, or reporting, or dissemination plans of this research.
Provenance and peer review Not commissioned; externally peer reviewed.