Article Text

Abstract
Objective The aim of this study was to investigate inequalities in primary healthcare visits by using the Gini coefficients of primary healthcare visits (GPVs) as derived from large-scale and region-wide electronic records and to explore estimation and utility of GPV.
Design The study used a cross-sectional study design. It first extracted a random sample of 7.09 million primary care records from 1 October 2019 to 31 December 2021. Then it developed logarithmic models of GPVs using different months of records and performed descriptive and generalised linear mixed-effects regression analyses of the GPVs for all-cause diseases. The study also produced topographic maps of the GPVs for nine selected diseases.
Setting All primary healthcare facilities within the 105 townships or communities randomly selected from Anhui province, China.
Participants All practising doctors working with and all patients presenting to the above sampled facilities during the 27-month study period.
Results The overall rate of primary healthcare visits during the 27-month period was estimated at 147.78%, with intra-regional variation coefficients by all-cause and system-specific disease ranging from 49.02% to 68.96%, and women were more likely than men to seek primary healthcare. The observed GPVs for all-cause and system-specific diseases all fitted very well with logarithmic equations and the goodness of fit increased rapidly when the months of EMRs were extended for the first few months, being over 78.92%, 91.17% and 94.78% for the first 3 months, 6 months and 12 months, respectively. These logarithmic models predicted at least high disparity (GPV>0.4) for all the system-specific diseases when the time period reached 6 months to 8 years. The observed GPVs for system-specific diseases, as estimated using the 27-month electronic medical records, ranged from 0.341 for skin-immune disease to 0.514 for cardiovascular disease. While the observed GPVs for all causes witnessed: great inter-region variations, with the highest GPV being 4.38 times the lowest; a general decreasing trend over the 9-quarter period, being reduced by 18.48% on average; and atypical J-shaped trajectories along age groups for both sexes. The multivariate modelling revealed statistically significant associations between the all-cause-GPV and 10 out of 14 commonly available community-level variables studied.
Conclusions GPVs can be accurately estimated using a limited number of months of EMRs and, guided by the relevant framework, analysis of GPVs can unveil useful clues in addressing unequal primary healthcare utilisation.
- Health Equity
- Electronic Health Records
- Primary Care
- China
Data availability statement
Data are available upon reasonable request. Aggregate data that underly the results reported in this article will become available as appendixes upon article publication. Detailed data about specific electronic records will be shared with researchers who provide a methodologically sound proposal. Proposals should be directed to shenxr@ahmu.edu.cn. To gain access, data requestors will need to sign a data access agreement.
This is an open access article distributed in accordance with the Creative Commons Attribution Non Commercial (CC BY-NC 4.0) license, which permits others to distribute, remix, adapt, build upon this work non-commercially, and license their derivative works on different terms, provided the original work is properly cited, appropriate credit is given, any changes made indicated, and the use is non-commercial. See: http://creativecommons.org/licenses/by-nc/4.0/.
Statistics from Altmetric.com
STRENGTHS AND LIMITATIONS OF THIS STUDY
This study introduced Gini coefficients of primary healthcare visits (GPVs) as a measure for monitoring and promoting the service equality.
The study used large-scale, province-wide and real-word electronic records of primary healthcare encounters as source data.
The study performed relatively detailed descriptive analysis and logarithmic and generalised linear mixed-effects regression modelling of GPVs.
The study used nine quarters of electronic records and thus revealed only short-term to mid-term characteristics of GPVs.
Routinely collected electronic records may be prone to biases due to incomplete and inaccurate recording and incompatible definitions or standards.
Background
Health inequality defines differences in health of individuals or groups, while health inequity, or health disparity, denotes unjust differences in health.1 There are compelling reasons to worry about and address health inequality/inequity. Persistent health differences between nationality, race or other social factors not only undermine efficiency of health systems but also violate fundamental principles of fairness and justice.2 Consequently, health equity has been widely recognised as an indispensable goal of public health policy and practice. It is reflected in the missions and strategies of nearly all national and international health organisations, including the global Sustainable Development Goals (SDGs), the aspiration for universal health coverage, the United Nations SDGs, and the Healthy China Action Plan.3–6 Despite considerable attention to the problem of health inequalities, striking disparities in health still exist among and within countries.7 A wide range of factors can affect attainment of fair and just opportunity for everyone to achieve optimal health. Health and social inequalities are closely intertwined. Systems may treat people differently due to age, gender, race, ethnicity, sexual identity, disability, or social and economic status. Cultures and traditions also play an important role in shaping our views and approaches to healthcare.8–10
Publications about health inequality/inequity have been growing rapidly since the 1980s, especially in the past decade. While a diverse array of differences in health outcomes and services have been documented, existing studies often focus on relatively uncommon groups, events or procedures, such as ethnic minorities, the poor and uneducated, individuals with intellectual and developmental disabilities, COVID-19 testing and vaccination, oral health and care, revolutionary movements, and financial hardships.11–16 Another feature observable from the publications concerns study purposes. Most studies focused on identifying and quantifying existent inequalities or inequities, with relatively few dedicated to exploring operational solutions to mitigate health disparities.17 18 A third feature from the publications relates to initiatives against health inequities at different levels. Various approaches for combatting health inequity at international and national levels has been documented, including legislations and strategic planning, establishment of leadership agencies, monitoring measures and reports on insurance and subsidy systems and others.19 20 There is a relative paucity of research on interventions at community or provider levels. A fourth feature from the publications pertains to indicators and data sources used. Most studies adopted multiple measures of health inequality or inequity, with the Gini coefficient being the most commonly used, followed by the Theil Index, Lorenz curve and coefficient of variation.21–23 These indicators were predominantly derived from periodic reports, such as annual statistics book or ad hoc research databases, with very few based on routinely collected electronic medical records (EMRs).24
This study aims to explore the feasibility, characteristics and utility of the Gini coefficients of primary healthcare visits (GPV) in Anhui province, China, using the province-wide EMR data. The Gini coefficient is most commonly used to measure income or wealth inequality.25 26 It ranges from 0 (perfect equality) to 1 (perfect inequality), with 0.4 generally viewed as the cut-off value of equality versus inequality.27 The GPV adapts the concept and calculation method of the Gini coefficient but measures the extent of unequal healthcare utilisation by different groups of residents. Given the large volume and rich information about health and sociodemographics of individual patients, EMR may prove to be the most valuable data source for identifying and addressing equity challenges.28 In particular, measures based on EMRs (especially region-wide EMRs) can be easily incorporated with existing information systems and leveraged into continuous monitoring, feedback and improvement in health equality/equity. However, this depends heavily on conception, presentation and interpretation of proper measures out of the unstructured and complicated EMRs. Such efforts are generally lacking, especially in developing countries, including China.29–31
Methods
Study content and data sources
This study used data from two separate sources. The bulk of the data were extracted from the EMRs stored at the province-wide data centre of Anhui, an inland province of China with a population of 61 million and a geographical area of 140 100 km2.32 Like other provinces in China, Anhui consists of three layers of administrative subunits, namely regions (n=16), counties (105), and townships in rural areas (n=1239) or communities in cities (n=262). A province-wide EMR centre in Anhui was established in October 2019. To ensure representativeness, our study adopted stratified random sampling in selecting areas and primary healthcare providers, which proceeded in three steps: (1) Inclusion of all the administrative regions and counties in Anhui; (2) Random selection of one township or community from each of the 105 counties; and (3) Inclusion of all the healthcare providers within the selected townships or communities. Such sampling was adopted to ensure that the records extracted are representative for both the regions and healthcare providers. As a result, 105 health centres and 7820 clinics were included. All EMRs from these clinics and centres were extracted from the data centre. The content of these records included the patient’s name, sex and age, time of consultation, and diagnosis given by the doctor.
Our study also extracted data about the selected townships or communities.32 Specific extracted variables included: (1) Per capita gross domestic product (GDP), per capita income, land area, land terrain, distance to the nearest higher-level cities, population size, average life expectancy, health workers per 1000 people, health facilities per 1000 people, ward beds per 1000 people.
Data process and analysis
The extracted data were first cleaned by: removal of records with missing or unrecognisable content in any of the preset items (including sex, age, time of consultation, diagnosis and region); elimination of records with illogical or extreme values; classification of the diagnoses given by physicians into diseases of eight selected systems (ie, respiratory, digestive, endocrine, cardiovascular, skin and immune, musculoskeletal, genitourinary and others); and identification of nine selected diagnoses (eg, infectious diseases, gastritis, enteritis, atherosclerotic heart diseases). The classification and identification were completed automatically using verified algorithms. The verification was performed independently by two experienced primary care clinicians over a random sample of 1800 records and the consistency between the classifications and diagnoses given by the algorithms and human clinicians reached over 97.67%. The eliminated records accounted for <0.1% of all the records extracted.
The cleaned data were then used to produce: (1) GPVs for all causes and by diseases of specific physical systems and administrative regions; (2) GPVs by different number of consecutive months; (3) GPVs by different regions and quarters; (4) Topographic maps displaying the GPVs by geographical regions for the nine selected diseases; (5) Logarithmic models of the associations between system-specific GPVs and months of records used for calculating the GPVs and goodness of fit (GOF) for the resultant models; and (6) Generalised linear mixed-effects regression modelling.
The GPV was calculated using formula 1:  , where i=1, 2, …, n; n=the number of groups; Xi=the proportion of the number of patients in the ith group; Yi=the proportion of the number of visits in the ith group; and
  = the cumulative proportion of visits in the ith groups. According to this formula: the maximum GPV is 1; the minimum is 0; and the closer the GPV to 0, the more equal the utilisation of the primary care service among different subgroups. The logarithmic modelling used formula 2:
  , where pGPV=simulated GPV; X=months of records used for calculating the pGPV; a=estimated coefficient; b=estimated constant. The GOF of the resultant logarithmic models was assessed using formula 3:
  , where
  and
and  stand for observed and predicted GPVs for the ith month, respectively. The use of logarithmic modelling was decided on by comparing the GOF between various models such as linear regression and polynomial models. The generalised linear mixed-effects regression modelling used the all-cause GPV as the dependent variable and 14 commonly studied community-level variables as the independent variables including: population size and density; ratio of men to women; life expectancy; per capita GDP and income; health facilities and ward beds per 1000 people; landscape; and distance to county and prefecture-level city.
Selection of the Gini coefficient was based mainly on its popularity and ease of use. As mentioned earlier, other commonly used indicators of health inequality include the Theil Index, coefficient of variation, Lorenz curve, etc. All of these indicators are closely linked and each has its own advantages and disadvantages. They are often used complementarily to provide a more nuanced understanding of equity and equality within a society.33 34 In particular, the Gini coefficient equals twice the area between the Lorenz curve and the line of equality. Combined use of these two indicators is beneficial since the Gini coefficient provides a single metric for measuring inequality, while the Lorenz curve offers a more detailed visual distribution across different segments of the population. However, the space limit did not allow application of multiple indicators and thus the Gini coefficient was selected because it is easy to calculate and understand and widely accepted for comparison across countries.
The data cleaning and GPV calculation were performed using Microsoft SQL Server 2008R2 via self-designed algorithms. The topographical maps with coloured gradients representing different levels of GPV in various regions were produced using QGIS V.3.32 software.
Patient and public involvement
It was not appropriate or possible to involve patients or the public in the design, or conduct, or reporting, or dissemination plans of our research.
Results
Overview of records extracted
As shown in online supplemental appendix 1, a total of 7.09 million records were extracted. These records involved 2.52 million patients, including 1.25 million men and 1.27 million women. The total population of the 16 regions ranged from 1.31 million to 9.37 million and people living in the sampled areas in each of these regions accounted for 3.63%–15.25% of its total population. The overall rate of primary healthcare visits during the 27-month period was estimated at 147.78%, with respiratory system diseases contributing the highest proportion (50.22%), followed by cardiovascular diseases (44.84%), digestive diseases (22.50%) and genitourinary diseases (22.46%). Women were more likely than men to seek primary care for diseases of all the eight systems studied. Age-specific visit rates for all-cause and system-specific diseases exhibited J-shaped trajectories. More specifically, the rates started relatively high in the 0–5 years age group and then decreased gradually to the lowest around 16–25 years and turned to increase until around 66–75 years. Significant inter-regional variations in visit rates were observed, with coefficients of variation ranging from 49.02% for cardiovascular system disease to 68.96% for other diseases.
Supplemental material
GPVs by months of records
Figure 1 and online supplemental appendix 2 display results from our logarithmic modelling of the relations between GPVs and months of EMRs used for calculating the measures. Observed GPVs (GPVs calculated directly from the EMRs) for all-cause and system-specific diseases all closely fitted a logarithmic equation, with a positive coefficient range from 0.0456 for skin immune system disease to 0.1012 for endocrine system disease. The GOF between the observed and predicted GPVs increased rapidly for the first few months and reached over 78.92%, 91.17% and 94.78% when the months of EMRs were extended to 3 months, 6 months and 12 months, respectively. The observed GPVs as estimated using the 27-month EMRs ranged from 0.341 for skin immune disease to 0.514 for cardiovascular disease; while the predicted GPVs, using the fitted logarithmic equations, all exceeded ‘high inequity’ (GPV>0.40) within a short to medium period, for example, 6 months for all causes, 8 months for cardiovascular diseases, 41 months for digestive system diseases.
Supplemental material

Observed versus predicted Gini coefficients of visits to primary care settings by months of records. Observed versus predicted Gini coefficients of visits to primary care settings by months of records. CVD, cardiovascular system disease; DSD, digestive system disease; ECD, endocrine system disease; GPV, Gini coefficients of primary care visits; GUD, genitourinary system diseases; M, month; MSD, musculoskeletal system disease; pGPV, predicted GPV, the solid curves; RSD, respiratory system disease; SID, skin immune system disease .
GPVs by geographical regions
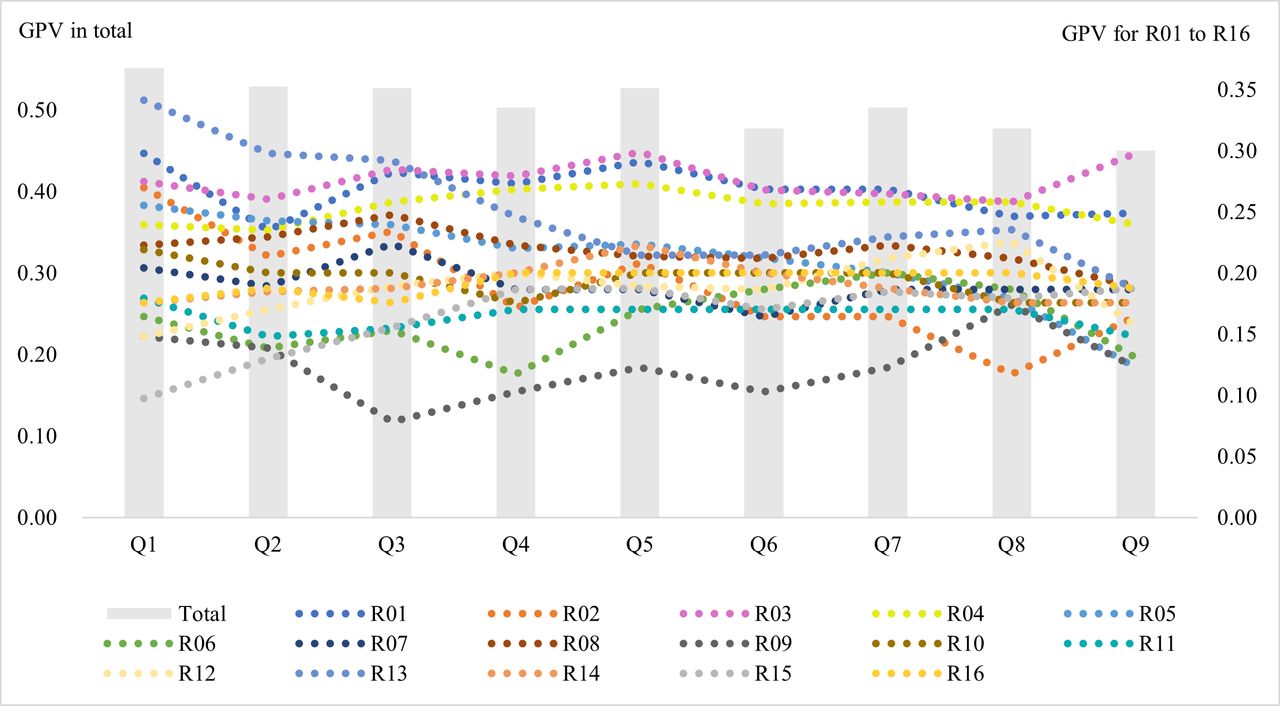
Figure 2 and online supplemental appendix 3 present the GPVs for all-cause diseases by different regions. R03 exhibited the highest mean GPV (0.415), followed by R01 (0.402) and R04 (0.381). Quarterly GPVs ranged from 0.512 for R13 in Q1 to 0.117 for R09 in Q3. The highest GPV was 4.38 times that of the lowest and the coefficient of variation was estimated at 23.8%. Most regions witnessed a decrease in GPVs over the nine quarters, with the largest reduction observed in R13 (from 0.512 in Q1 to 0.280 in Q9). While a small part of them (R03, R12, R15 and R16) presented some extent of increases.
Supplemental material

Gini coefficients of quarterly visits for all causes by regions. GPV, Gini coefficients of primary care visits; Q1 through to Q9, first through to ninth quarters of months, respectively, starting from October 2019; R01 through to R16, order, from north to south, of geographical regions in Anhui, China.
GPVs by sex and age
Figure 3 and online supplemental appendix 4 provide the GPVs for all diseases by sex and age groups. Both sexes witnessed a J-shaped trajectory of GPVs along the age groups. The ratios of max versus min GPVs for men and women were estimated at 1.83 and 1.74, respectively, and men had greater GPV than women for the under 5 years group but smaller GPVs for the 16–55 years age group (GPV=0.48 vs 0.51). In consistency with the overall time trend as mentioned above, all age groups manifested a general decreasing trend in their GPVs over the nine quarters. The magnitude of decreases was the greatest for those aged 6–65 years (by 20.28% to 30.16%), followed by those aged 0–5 years (16.49%); while the two eldest groups presented the least decreases (being 11.60% and 13.68%, respectively). In addition, younger age groups (eg, those aged 0–5 years and 6–15 years) witnessed larger variations in the quarterly GPVs than the older ones.
Supplemental material

Gini coefficients of all-cause primary care visits by sex and age. GPV, Gini coefficients of primary care visits; Q1 through to Q9, first through to ninth quarter of months, respectively, starting from October 2019.
Topographic maps of GPVs
Figure 4 and online supplemental appendix 5 show the topographic maps of GPVs for nine selected diseases over the 27 months. Of the nine maps, the ones representing chronic bronchitis or tracheitis, atherosclerotic heart diseases and spondylosis were most heavily coloured; while those representing infectious diseases and gastroenteritis featured the largest number of lightly coloured regions. R06, R09 and R12 were coloured the lightest for most of the diseases; while the opposite was for R03, R04 and R15. Multiple neighbouring regions with similar colours were observable in the maps of atherosclerotic heart diseases, urethral infections and enteritis. Singular regions surrounded by regions with sharp contrasting colours were found in the maps of infectious diseases for R12, chronic tracheitis or bronchitis for R12, and injuries or fractures for R06.
Supplemental material

Topographic map of Gini coefficients of visits for selected diseases. R01 through to R16, order, from north to south, of geographical regions in Anhui, China.
Multivariate modelling of GPVs
Table 1 summarises main statistics from our generalised linear mixed-effects regression analysis using the GPVs of all causes as the dependent variable. Of the 14 community-level independent variables studied, 10 were found with statistically significant (p<0.05) coefficients. In terms of magnitudes of coefficients, distance from the nearest prefecture-level city (1.089) ranked the greatest, followed by ward beds per 1000 people (0.938), per capita GDP (−0.896), average life expectancy (0.883) and per capita income (0.854). Positive predictors of the GPVs included distance from the nearest prefecture-level city, ward beds per 1000 people, average life expectancy, per capita income and population per village or community; while negative predictors included mountainous area, hilly area and ratio of men and women.
Statistics from generalised linear mixed-effects regression analysis of GPVs for all-cause diseases
Discussion
Principal findings
Guided by a comprehensive framework, this study took the advantage of large-scale and region-wide EMRs and performed descriptive and multivariate analysis of GPVs, which revealed novel and useful findings, including: logarithmic associations between GPVs and months of records used for calculating the measure for all-cause and specific diseases; high disparities in GPVs by diseases; great variations in GPVs between geographical regions; moderate decreasing trend over the study period; atypical J-shaped trajectory of GPVs across age groups; and statistically significant associations between all-cause GPV and most of the community-level variables studied.
Explanations and implications
The measure of GPV and related framework underlying this study should inform better understanding of unevenness in primary care utilisation and provision. Although there are publications about Gini coefficients of healthcare expenditures,35 little efforts have been published on GPVs.36 37 Like the Gini coefficients of income which measure unequal distribution of economic resource, GPVs indicate disparities in uptake of primary healthcare across population groups. As long as a visit satisfies, to some extent, the healthcare need and/or demand of the individual under concern, accumulation of visits can be viewed as desirable and thus maintaining minimum GPV can be viewed as an important health equity achievement. Yet the interpretation and use of GPV estimations is a challenging task since the causes of primary healthcare visits are very complex, involving three layers and three dimensions of determinants (‘3L3D’ for short). Here, 3L stands for physiological (L1), individual (L2) and community (L3) layers; while 3D denotes healthcare need (D1), healthcare demand (D2), and completeness and accuracy of EMRs (D3).38 Of these, healthcare need plays a key role and is further determined by the prevalence and nature of the health conditions under concern (eg, acute respiratory infections, hypertension, diabetes).39 Healthcare demand reflects the joint effect of healthcare effectiveness, availability, accessibility and affordability, and perceptions of these factors by healthcare consumers.40 While the completeness and accuracy of EMRs depends mainly on record quality governance.41
The logarithmic modelling of GPVs by months of records reveals useful findings. First, a minimum duration of records is needed for estimating GPVs. When the duration is too short (say 1 day or even a half day), a specific resident would either have no chance or need to seek healthcare or have only enough time to seek healthcare once. As the time interval increases, the chance for residents to seek healthcare for multiple times elevates. Second, the minimum duration varied substantially from diseases to diseases, being, for example, 2 months for all causes, 3 months for genitourinary system diseases and 13 months for endocrine system disease. Third, uneven primary care utilisation and provision were common since the logarithmic models predicted at least ‘high inequality’ (GPV>0.4) for all the system-specific diseases studied within a 6-month to 8-year period.
The GPVs by diseases primarily reflect the impact of pathological factors (L1:D1). For instance, high GPVs for cardiovascular system disease may be due primarily to the fact that these diseases generally occur among highly concentrated groups (eg, those aged over 40 years).42 These diseases often necessitate frequent revisits, especially among patients with severe hypertension.43 Similarly, the relatively high GPVs for respiratory diseases may be explained by elevated incidences of acute upper respiratory tract infections and exacerbation of chronic respiratory diseases among children under 5 years of age and the elderly.44 45
The GPVs by age and sex allow for distinguishing unevenness caused by individual-level factors (L2: D1, D2). Age is viewed as the most important single factor of health.46 Age-related GPVs may be explained by a whole range of factors including differences in physical (especially immunity) and psychological conditions, acute health risks borne from leisure and work activities, accumulated effects of chronic health hazards, and accessibility and affordability to primary healthcare.47–49 Yet when the study population is divided into small enough age groups, the intragroup ‘life-cycle’ differences are reduced to a minimum.50 Given these, the J-shaped GPVs of all-cause diseases along the age groups may be explained by unequal: exposer and susceptibility to acute aetiologies (eg, viruses, malnutrition) for the early ages (L2: D1)51 52; exposure to acute risks from leisure and work activities for the middle ages (L2: D1)53 54; accumulated chronic damages from unhealthy lifestyles (eg, smoking, sedentary work) for the over 40 years (L2: D1)55 56; and accessibility and affordability of primary care for the over 75 years (L2: D2).57 Similarly, the higher GPVs among men than women for children may due to varied ‘preference of sons over daughters’ in China, especially in rural areas (L2: D2).58 While the higher GPVs among women than men in adulthood may be because of additional service need for family planning, maternal care, menopause, and others by women (L2: D1).59 60
The GPVs by regions enable detection of inequalities arising from community-level or structural factors (L3: D2, D1, D3). The substantial inter-reginal disparities in the GPVs as presented in figure 2 and online supplemental appendix 3 (eg, the GPV for the highest region was 4.38 times that of the lowest) suggest that primary healthcare visits were most sensitive to community or structural influences. This is consistent with the topographic maps (which displayed clearly visible differences in the GPVs for all the nine selected diseases) and the findings from the multivariate modelling of the all-cause GPV (which revealed statistically significant coefficients for most of the 14 community-level variables considered). Topographic maps provide straightforward means for identifying potential geographical disparities and the following features merit particular attention in examining the maps: heavily coloured maps (eg, the maps for chronic tracheitis or bronchitis and atherosclerotic heart diseases) versus lightly coloured maps (eg, the map for infectious diseases and enteritis); heavily coloured regions (eg, R03 and R04) versus lightly coloured regions (eg, R06 and R09); cluster of regions with similar colours (eg, R01 to R08 in the maps of atherosclerotic heart diseases); singular regions surrounded by regions with sharp contrasting colours (eg, R12 in the map of infectious disease).
The GPVs by time, when examined in conjunction with factors included in the aforementioned 3L3D framework, may unveil useful clues for identifying further inequity issues. Such examination should pay particular attention to potential links from short-term trends and fluctuations in GPVs to easily changeable factors (eg, outbreak of infectious disease); and from long-term trends to relatively stable causes (eg, chronic diseases), cyclic variations to periodical influences (eg, seasonal climate changes), and similar time trajectories or patterns to shared factors between subgroups. Bearing these in mind, chronic conditions could be excluded from the reasons underlying the deceasing trend in the GPVs for all-cause diseases over the relatively short term (nine quarters) by age and sex observed in our study. Instead, it may be attributed to quicker changes like the introduction of a province-wide EMR system and rapid record quality improvement resulting from the new system;61 62 and/or health system reformation and strengthening, etc.63–65 Similarly, the increasing GPVs in our study for the four regions (R03, R12, R15 and R16) as contrasted by the decreasing GPVs for other regions may be explained by the characteristics shared by the four regions yet non-existent in the others, for example, relatively low per capita GDP, high population size and average life expectancy.
Strengths and limitations
Our study is advantageous since: it was the first to use GPVs for examining equality in primary care utilisation and provision; it employed a comprehensive framework in guiding the GPV analysis and interpretation; it used large-scale and province-wide electronic data sources and uncovered useful findings for better understanding and tackling inequality in Anhui and China. Our study also suffers from a number of shortcomings. First, it used nine quarters of EMRs and thus revealed only short-term to mid-term characteristics of GPVs. Second, it was based on routinely collected EMRs and was thus prone to biases due to incomplete or inaccurate recording, though there are indications that great quality improvement had been made since the introduction of the province-wide record system. Third, it focused primarily on the most common diseases and the readers are cautioned about potential differences in the GPVs for the non-selected diseases, especially those with substantially lower morbidities.
Conclusions
GPVs derivable from routinely collected EMRs are useful measures for examining inequality in primary healthcare utilisation and provision. GPVs can be accurately estimated using logarithmic modelling and a minimum yet limited months of records. High (GPV>0.4), even very high (GPV>0.6) inequality was observed or predicted for all the system-specific diseases studied in Anhui, China. There is a clear need for further studies on estimation of GPVs and mechanisms leveraging the findings for continuous equity improvement.
Data availability statement
Data are available upon reasonable request. Aggregate data that underly the results reported in this article will become available as appendixes upon article publication. Detailed data about specific electronic records will be shared with researchers who provide a methodologically sound proposal. Proposals should be directed to shenxr@ahmu.edu.cn. To gain access, data requestors will need to sign a data access agreement.
Ethics statements
Patient consent for publication
Ethics approval
This study was approved by the Biomedical Research Ethics Committee of Anhui Medical University (No. 83230511).
Acknowledgments
The authors thank all the graduate students who contributed to cleaning the data and drawing the figures.
References
Footnotes
NY and GL contributed equally.
Contributors XS was the principal investigator of the funding project. DW conceived the study. NY and JX performed the statistical analysis and drafted the first version of the manuscript. GL revised the manuscript. XY, GL, Jing Chai, Jing Cheng, ML and RL contributed to interpretation of findings and critically revised the manuscript. All authors approved the final version of the manuscript. DW is the guarantor.
Funding This study was jointly supported by the Key Social Science Project Fund of Anhui Province (grant number: 2022AH050622) and an evaluation project titled “Efficacy of the Intellectual Assistant for Primary Health Care in Anhui” (grant number: K2021235). All authors were entitled to all data and had ultimate responsibility for submission for publication.
Map disclaimer The inclusion of any map (including the depiction of any boundaries therein), or of any geographical or locational reference, does not imply the expression of any opinion whatsoever on the part of BMJ concerning the legal status of any country, territory, jurisdiction or area or of its authorities. Any such expression remains solely that of the relevant source and is not endorsed by BMJ. Maps are provided without any warranty of any kind, either express or implied.
Competing interests None declared.
Patient and public involvement Patients and/or the public were not involved in the design, or conduct, or reporting, or dissemination plans of this research.
Provenance and peer review Not commissioned; externally peer reviewed.
Supplemental material This content has been supplied by the author(s). It has not been vetted by BMJ Publishing Group Limited (BMJ) and may not have been peer-reviewed. Any opinions or recommendations discussed are solely those of the author(s) and are not endorsed by BMJ. BMJ disclaims all liability and responsibility arising from any reliance placed on the content. Where the content includes any translated material, BMJ does not warrant the accuracy and reliability of the translations (including but not limited to local regulations, clinical guidelines, terminology, drug names and drug dosages), and is not responsible for any error and/or omissions arising from translation and adaptation or otherwise.