Article Text

Abstract
Introduction Models derived from non-Sri Lankan cohorts are used for cardiovascular (CV) risk stratification of Sri Lankans.
Objective To develop a CV risk prediction model using machine learning (ML) based on data from a Sri Lankan cohort followed up for 10 years, and to compare the predictions with WHO risk charts.
Design Cohort study.
Setting The Ragama Health Study (RHS), an ongoing, prospective, population-based cohort study of patients randomly selected from the Ragama Medical Office of Heath area, Sri Lanka, focusing on the epidemiology of non-communicable diseases, was used to develop the model. The external validation cohort included patients admitted to Colombo North Teaching Hospital (CNTH), a tertiary care hospital in Sri Lanka, from January 2019 through August 2020.
Participants All RHS participants, aged 40–64 years in 2007, without cardiovascular disease (CVD) at baseline, who had complete data of 10-year outcome by 2017, were used for model development. Patients aged 40–74 years admitted to CNTH during the study period with incident CV events or a disease other than an acute CV event (CVE) with complete data for CVD risk calculation were used for external validation of the model.
Methods Using the follow-up data of the cohort, we developed two ML models for predicting 10-year CV risk using six conventional CV risk variables (age, gender, smoking status, systolic blood pressure, history of diabetes, and total cholesterol level) and all available variables (n=75). The ML models were derived using classification algorithms of the supervised learning technique. We compared the predictive performance of our ML models with WHO risk charts (2019, Southeast Asia) using area under the receiver operating characteristic curves (AUC-ROC) and calibration plots. We validated the 6-variable model in an external hospital-based cohort.
Results Of the 2596 participants in the baseline cohort, 179 incident CVEs were observed over 10 years. WHO risk charts predicted only 10 CVEs (AUC-ROC: 0.51, 95% CI 0.42 to 0.60), while the new 6-variable ML model predicted 125 CVEs (AUC-ROC: 0.72, 95% CI 0.66 to 0.78) and the 75-variable ML model predicted 124 CVEs (AUC-ROC: 0.74, 95% CI 0.68 to 0.80). Calibration results (Hosmer-Lemeshow test) for the 6-variable ML model and the WHO risk charts were χ2=12.85 (p=0.12) and χ2=15.58 (p=0.05), respectively. In the external validation cohort, the sensitivity, specificity, positive predictive value, negative predictive value, and calibration of the 6-variable ML model and the WHO risk charts, respectively, were: 70.3%, 94.9%, 87.3%, 86.6%, χ2=8.22, p=0.41 and 23.7%, 79.0%, 35.8%, 67.7%, χ2=81.94, p<0.0001.
Conclusions ML-based models derived from a cohort of Sri Lankans improved the overall accuracy of CV-risk prediction compared with the WHO risk charts for this cohort of Southeast Asians.
- Risk management
- Preventive Medicine
- Primary Prevention
- Cardiac Epidemiology
Data availability statement
Data are available upon reasonable request. The datasets used and analysed during the current study are available from the corresponding author upon reasonable request.
This is an open access article distributed in accordance with the Creative Commons Attribution Non Commercial (CC BY-NC 4.0) license, which permits others to distribute, remix, adapt, build upon this work non-commercially, and license their derivative works on different terms, provided the original work is properly cited, appropriate credit is given, any changes made indicated, and the use is non-commercial. See: http://creativecommons.org/licenses/by-nc/4.0/.
Statistics from Altmetric.com
STRENGTHS AND LIMITATIONS OF THIS STUDY
We developed the risk prediction models using machine learning (ML) of 10-year follow-up data of individual patients.
We used 10-year follow-up data from a large, population-based, randomly selected sample to develop the model.
Even though the cohort we used to train the ML model was a community-based, multi-ethnic random cohort, representation of the state sector was less in our cohort compared with the national distribution.
The data imbalance due to having very few female smokers might have influenced the model’s performance, but this was minimised with stratified 10-fold cross-validation.
Introduction
No cardiovascular (CV) risk prediction models are specific to, or derived from, Sri Lankans. Therefore, different risk prediction models derived from white Caucasians or models developed for the Southeast Asia region (SEAR) are used for the CV risk stratification of Sri Lankans.
Asians have a different CV risk than white Caucasians. Asians have a distinct genetic make-up and a different CV risk factor profile, with a higher prevalence of hypertension, diabetes mellitus, central obesity, insulin resistance, and metabolic syndrome than white Caucasians.1 They are also at increased risk of developing CV diseases (CVDs) than white Caucasians at a given risk factor level.1 There is little agreement between the CV risk predictions of Sri Lankans based on the WHO/International Society of Hypertension (WHO/ISH) risk charts and the Framingham General CV risk charts.2 Moreover, the CV risk predictions in a Sri Lankan cohort using three different risk models, the National Cholesterol Education Programme - Adult Treatment Panel III (NCEP-ATP III), WHO/ISH charts, and Systematic Coronary Risk Evaluation (SCORE) charts, were discordant.3
The WHO/ISH CV risk charts for the Southeast Asia region-B (SEAR-B) were developed in 2007, with another 14 for different epidemiological subregions, to predict the CV risk of people of those regions who did not have specific risk prediction models derived from their cohorts.4 Thulani et al validated 2007 WHO/ISH risk charts among Sri Lankans and observed 81% agreement between predictions and observed events, but the charts were less predictive in women and those at high CV risk.5 Later, the WHO risk charts were revised and recalibrated in 2019 to improve predictive capacity and expanded to 21 epidemiological subregions that did not have specific risk prediction models. These 2019 WHO risk charts are currently the best available for Sri Lankans.6 However, in these charts, Sri Lanka is grouped under the Southeast Asia epidemiological subregion, comprising Indonesia, Cambodia, Laos, Sri Lanka, Maldives, Myanmar, Malaysia, Philippines, Thailand, Timor-Leste, Vietnam, Mauritius, and Seychelles. Southeast Asians are a heterogeneous population with different socioeconomic and cultural backgrounds, and therefore, the risk predictions might not accurately represent Sri Lankans' CV risk.
Therefore, we aimed to develop a CV risk prediction model using machine learning (ML) based on data from a Sri Lankan cohort that was followed up for 10 years and compare the predictions with 2019 WHO (Southeast Asia) risk charts. Moreover, we aimed to validate the new model in an external cohort of Sri Lankans.
Methods
Machine learning model development
We developed two CV risk prediction models using ML, based on data from a large community-based study on non-communicable diseases, the ‘Ragama Health Study (RHS)’,3 7 where individuals have been followed up from 2007 to date.
The baseline study population (n=2923) in the RHS comprised 35–64 year-old adult residents in the ‘Ragama Medical Office of Health (MOH) area’ in 2007.7 Participants were selected by stratified random sampling in the Ragama MOH area, which is a semi-urban health administrative area among 25 districts in Sri Lanka. Participants were followed up for 10 years from 2007 to 2017, during which all CV deaths, non-fatal strokes, and non-fatal myocardial infarctions (including those undergoing percutaneous coronary interventions and coronary artery bypass grafts) were recorded as hard CV events (CVEs) by either interviewing patients and their families or perusing clinical notes/death certificates.8
Data for participants above 40 years of age, who had no history of CVDs at enrolment in 2007 and completed the 10- year follow-up (n=2596), were extracted to develop ML-based risk prediction models, as risk predictions are usually calculated in people aged over 40 years.
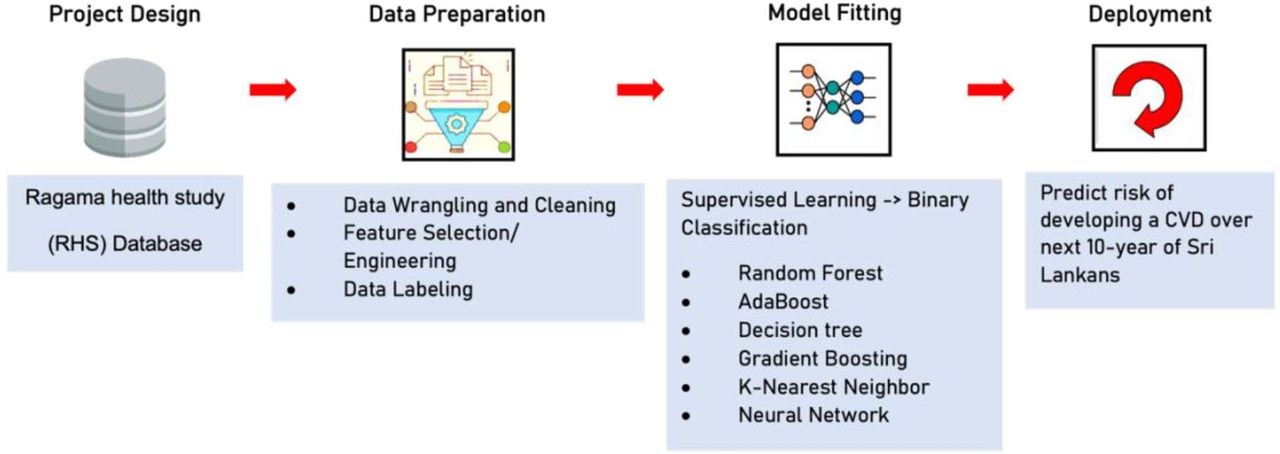
Using the 10-year prospective follow-up data for the cohort, and the baseline data of those who developed CVEs and those who did not, we developed two ML-based models to predict the 10- year risk of developing a hard CVE using different risk factor combinations. Individuals who could not be traced in 2017 or those whose cause of death could not be verified were excluded. The ML-based models were developed using classification algorithms of the supervised learning technique. The models were developed in a recursive process8 in four steps: project design, data preparation, model fitting, and inference and deployment (figure 1). Models were built using the publicly available Google Colab ML platform, the Scikit-learn library in Python,9 and the Train-Test Split method.10 Participant data were split into two groups: the training and testing samples. The training sample was used to build the ML-based models, and the testing sample was used to assess the efficacy of the algorithms built using the training sample. Since the ratio of CVE to non-CVE was highly skewed at 7:93, we performed stratified 10-fold cross-validation, using 2336 individuals for the training sample and the remaining 260 for the test sample to prevent overfitting.

Machine learning model development process.
The predictive performances of the models were compared. We determined the discriminative power using the area under the receiver operating characteristic curve (AUC-ROC, c-index) and the mean F1-scores. The mean of AUC-ROCs for the 10 cross-validation samples was taken as the AUC-ROC of the ML-based model in question. The AUC-ROC and mean F1-score were used to select the best model. A model with a mean F1-score above 0.8, accuracy above 0.85 and AUC c-index closer to 1 was considered suitable for risk prediction.9 10 We calibrated the models using calibration plots. A model with a Hosmer-Lemeshow test χ2 value of >20 or a p value of <0.05 was considered poor calibration.11
We trialled six standard ML classification algorithms with different modelling approaches: decision tree, random forest, k-nearest neighbour, 2D neural networks, AdaBoost, and gradient boosting. We selected the best-fitting model according to the mean F1-score and AUC-ROC to develop the final model. Grid search was used to optimise the hyper-parameters of the models.11 Data imputation for all models was done using Python’s statistical imputation of missing values.
We developed two risk prediction models; one using the six conventional CV risk variables used in the WHO CV risk charts (age, gender, smoking status, systolic blood pressure, history of diabetes, and total cholesterol level) and the other using 75 variables. The total database consisted of 770 variables, including data on demographics, medical history, family history, social history, physical examination, laboratory investigations, and non-laboratory investigations like ECG and an ultrasound scan of the abdomen. After data wrangling and cleaning, we chose 75 (out of 770) variables following the literature review and using domain knowledge for the ML model development. We excluded variables with missing values ≥50%. By machine learning the database, the models predicted individuals likely and unlikely to develop a CVE within the next 10 years.
Internal validation of the machine learning model
We calculated the predicted CVEs over 10 years by 2017, using baseline data (2007 data) and the two ML models separately. Additionally, we calculated the same using the latest 2019 WHO CV risk charts. We compared the predictions of the 6-variable and 75-variable ML models and the WHO model against the observed events using AUC-ROC and mean F1-score.
External validation of the 6-variable machine learning-based model
We externally validated the 6-variable ML model in a separate hospital-based database of 357 consecutive patients, aged 40–74 years, admitted to Colombo North Teaching Hospital (a tertiary care hospital in Sri Lanka) between 1 January 2019 and 1 August 2020 who did not have a history of CVEs and presented with an acute incident CVE (acute myocardial infarction or acute stroke) or a disease other than an acute CVE and who had complete data for CVD risk calculation. Their predicted risks of developing a CVE were calculated using the most recent pre-morbid risk factor data available up to 1 year before the incident CVE or the admission to the ward in non-CVE cases. We compared the predictions of the 6-variable model with that of the 2019 WHO risk chart using confusion matrices and calibration plots.
Ethical clearance
This work was approved by the ethics review committee of the Faculty of Medicine, University of Kelaniya, Sri Lanka (P38/09/2006, P169/08/2014, P206/08/2017), ML development and external validation cohort (P61/09/2020). Written informed consent was obtained from all the participants.
Patient and public involvement
It was not appropriate or possible to involve patients or the public in the design or reporting plans of our research, but they were involved in the conduct and dissemination of the study. All patients are routinely followed up in a non-communicable disease clinic at the Faculty of Medicine, in collaboration with North Colombo Teaching Hospital (NCTH) Ragama, Sri Lanka, as a service component since 2007. Information about their risk factors was available to participants, and when necessary, they were referred for specialist care at the NCTH. The study results will be disseminated to study participants, other patients, and the public following publication.
Results
A total of 2596 participants followed up for 10 years were eligible for the study with a mean (SD) age of 53.5 (6.9) years and 1162 (44.8%) were male. The baseline characteristics of the study cohort are shown in table 1.
Baseline characteristics of the cohort
We tested six ML algorithms to find the best predictive CV risk prediction model using 6-variables and 75-variables separately. A comparison of model performances using different ML algorithms is shown in online supplemental table 1. Random forest models showed the highest accuracy, mean F1-score, and AUC-ROC for both 6-variable and 75-variable ML models and were selected as the final ML-based models.
Supplemental material
The 20 most important variables for predictive performance in the descending order of the 75-variable model developed on the random forest algorithm are shown in table 2.
Variable ranking by their contribution to cardiovascular risk predictions
The predicted CVEs by the newly developed ML-based models (6-variable and 75-variable) and the WHO risk charts (2019) for the next 10 years using baseline data of 2007 were compared with the observed CVEs by 2017 using AUC-ROC curves and confusion matrices (figure 2).

Comparison of the predictive performance of machine learning-based models and the WHO cardiovascular risk charts (Southeast Asia Region, 2019) in a Sri Lankan cohort. ML, machine learning.
Discrimination of the three models using AUC-ROC and c-indexes were; 75-variable model: 0.74 (95% CI 0.68 to 0.80), 6-variable model: 0.72 (95% CI 0.66 to 0.78), and WHO risk charts: 0.51 (95% CI 0.42 to 0.60). Accuracy of the rate of prediction of the actual CV risk of the population (predicting both true positive and true negative CVEs) was: 75-variable model: 93.1% (2417/2596), 6-variable model: 93.1% (2418/2596), and WHO risk charts: 91.8% (2382/2596) (figure 2).
The predictive accuracies of the three models were studied using confusion matrices (figure 2). The 75-variable model predicted 124 of 179 CVEs and 2293 of 2417 non-CVE cases correctly; sensitivity - 69.3%, positive predictive value (PPV) - 50.0%, specificity - 94.8%, negative predictive value (NPV) - 97.6%. The 6-variable model correctly predicted 125 of 179 CVEs and 2293 of 2417 non-CVE cases; sensitivity - 69.8%, PPV - 50.2%, specificity - 94.8%, NPV - 97.6%. The WHO risk charts predicted only 10 of 179 cases but 2372 of 2417 non-CVE cases correctly; sensitivity - 5.6%, PPV - 18.2%, specificity - 98.1%, NPV - 93.3%. The 75- and 6-variable models, respectively, correctly predicted 114 and 115 more CVEs than the 10 CVEs predicted by the latest WHO risk charts.
The calibration for the 6-variable ML model was good as the Hosmer-Lemeshow test result was χ2=12.85, p=0.12. the Hosmer-Lemeshow test result for the WHO risk charts was χ2=15.58, p=0.05. (online supplemental table 2, figure 3)
Supplemental material

External validation of the 6-variable machine learning (ML) model in cardiovascular risk predicting.
The 6-variable ML-based model was validated in an external cohort of 357 hospital-based patients. The external validation cohort consisted of 118 incident CVE cases and 239 non-CVE cases, 117 (32.8%) men with a mean (SD) age of 63.4 (7.2) years. Their CVE risk predictions were calculated using the 6-variable model and WHO risk charts separately. The predicted and observed number of CVEs were compared using confusion matrices (figure 4). The predictive accuracy of the 6-variable model was 83/118 cases (sensitivity 70.3%, PPV 87.3%) and 227/239 non-CVE cases (specificity 95.0%, NPV 86.6%). In comparison, the predictive accuracy of WHO risk charts was 28/118 cases (sensitivity 23.7%, PPV 35.8%) and 189/239 non-cases (specificity 79.1%, NPV 67.7%). The 6-variable model correctly predicted 55 more cases of CVEs than the 28 cases predicted by the currently used 2019 WHO risk charts. Calibration for the 6-variable ML model in the external validation cohort was also good, with the Hosmer-Lemeshow test result of χ2=8.22, p=0.41, while that of WHO risk charts was χ2=81.94, p<0.0001 (online supplemental figure 1).
Supplemental material

Calibration for 6-variable machine learning model and WHO risk charts in the original cohort.
Discussion
We developed two ML-based CV risk prediction models using longitudinal data of a Sri Lankan cohort prospectively followed up for 10 years. The ML-based models were the first CV risk prediction model developed using individual data from Sri Lankans and the only risk prediction model specific to Sri Lankans. The newly developed 6-variable ML-based model predicted CVE with a 70% sensitivity and 95% specificity in an external cohort. The overall predictive performances of the ML-based models in Sri Lankans were better than that of the reference WHO CV risk charts developed for the whole of Southeast Asia region (2019). The newly developed ML-based models appear to be more effective in the prediction of people at high CV risk compared with the WHO risk charts and are equally effective as the WHO score in predicting people at low CV risk. Validation of the 6-variable ML-based model in an external cohort of Sri Lankans re-confirmed the findings, showing very good calibration for the 6-variable ML model and poor calibration for the WHO risk charts.
Improved CV risk prediction allows identification of more patients who could benefit from preventive treatment while avoiding unnecessary treatment of those at low risk.12 The WHO risk charts developed for the Southeast Asia region are good in detecting Sri Lankans at low risk of CVDs but are less sensitive in predicting patients who are at high risk of CVDs. The same was observed while validating the 2007 WHO/ISH risk charts among Sri Lankans.5 The low accuracy in predicting high-risk individuals using the WHO risk charts can be explained by several factors. The WHO risk charts were developed using the epidemiological data of the member countries available to predict the CV risk of the people of the Southeast Asia region. However, our ML-based models were developed using individual patient data from a Sri Lankan cohort that had been followed up for 10 years and, therefore, are more specific for Sri Lankans. Further, we developed the prediction models using ML data from a prospectively followed-up Sri Lankan cohort. ML allows the models to appreciate subtle, complex interactions between variables in predicting outcomes rather than using conventional logistic regression, making our ML-based models more specific for Sri Lankans.
CV risk prediction using ML is now being used globally and reported to be better than traditional risk prediction models.12–17 Several studies from the UK have shown the superiority of ML-based models over conventional models in predicting CV risk. Alaa et al showed that ML-based risk predictions improved the accuracy of CV risk prediction in 423 604 participants of the UK Biobank compared with the Framingham risk score.14 Another study of 378 256 patients from UK family practices showed that a new ML model using eight conventional variables significantly improved the accuracy of CV risk prediction.10 Another recent study using a novel prediction model comprising 10 predictors in a cohort of the UK Biobank showed better performance over multiple existing clinical models.17 A study involving 143 043 Chinese patients with hypertension also showed that ML outperforms traditional logistic regression for CV risk prediction.16 Our results for the two ML models in Sri Lankans corroborate these previous findings in other populations.
The study by Alaa et al using the UK Biobank data showed that the predictive capacity of the ML model when using all available 476 variables was better than that when using only the traditional variables.14 However, we did not find a significant difference in predictive performance when using all available variables (n=75) compared with six traditional variables in the ML models in our cohort. Several explanations are possible for the lack of difference between the two ML models in this cohort—for example, the cohort sample size was too small to identify risk factors with minor contributions, and the 75 variables available in this study did not contain enough detail to provide additional information to the six traditional variables.
A meta-analysis of ML algorithms used for CVD prediction has highlighted the importance of using the optimal algorithm for the datasets being used owing to heterogeneity among ML algorithms.18 A recent review on artificial intelligence (AI) and CV risk prediction has shown that AI-based predictive models might overcome some of the limitations of classic regression models. Nevertheless, the successful application of AI requires knowledge of the potential pitfalls in AI techniques to guarantee their safe and effective use in daily clinical practice.19 We trialled six standard ML classification algorithms with different modelling approaches, and our models confirmed the importance of the already known conventional CV risk factors in predisposition to CVD. This finding also adds to the validity of our results. In a resource-limited country such as Sri Lanka, our 6-variable model would be more practical than the 75-variable model to screen individuals at higher CV risk, as it is as predictive as the 75-variable model. The 6-variable ML model is more predictive than WHO risk charts, especially in high-risk people, who should be the main target for primary prevention of CVDs.
Our study has several strengths. Our cohort is a community-based random sample. The study area consisted of 75 591 multi-ethnic residents in 2007. Participants were prospectively followed up for 10 years. The dropout rate was very low, and only the data of participants who completed 10-year follow-ups were used to develop the ML models. Patients were recruited and followed up by medical officers using face-to-face interviews and perusing medical records, including death certificates where applicable, and therefore self-reporting bias was minimised. Individual patient data were used to develop the model. The endpoints used (hard CVE) were clear and objective.
Our study has some limitations. For example, even though our cohort is community-based, it is from a semi-urban area and might not represent the whole of Sri Lanka. According to the 2012 census, however, the overall national distribution of the population in the urban–rural sectors is 1: 4.5, comparable to 1: 5.4, in the Gampaha district. Imputation of missing data and imbalance of data due to having very few female smokers might have some influence on the model’s performance, but this was minimised with stratified 10-fold cross-validation.
In conclusion, we have shown that the new models developed by machine learning using individual participant follow-up data of a Sri Lankan cohort were more predictive of CV risk, especially of high-risk Sri Lankans, than the WHO CV risk charts for the Southeast Asia region (2019). We plan to improve predictions of the model by using data from a larger sample and to develop a web/mobile interphase of the new 6-variable model to increase its clinical usefulness.
Data availability statement
Data are available upon reasonable request. The datasets used and analysed during the current study are available from the corresponding author upon reasonable request.
Ethics statements
Patient consent for publication
Ethics approval
This study involves human participants and was approved by the ethics review committee of the Faculty of Medicine, University of Kelaniya, Sri Lanka (P38/09/2006), machine learning development and external validation cohort (P61/09/2020). Written informed consent was obtained from all the participants to participate in the study before taking part.
Acknowledgments
We thank all those who have continuously supported the Ragama Health Study, and especially the study participants for their continued cooperation.
Footnotes
X @a_kasturiratne, @I do not have an account
Contributors CM, MS and PH conceptualized and designed the study. AK, ASD, RW, NK and HJdS were involved in establishing the Ragama Health Study cohort. MS and PH analysed the data assisted by CM. CM, MS and HJdS prepared and revised the manuscript. All authors read and agreed to the final version of the manuscript. CM is the guarantor.
Funding This study was supported by the Strengthening Research Outputs Grant of the University of Kelaniya, Sri Lanka (RC/SROG/2021/01). The funding bodies played no role in the design of the study, collection, analysis, and interpretation of data or in writing the manuscript.
Competing interests None declared.
Patient and public involvement Patients and/or the public were not involved in the design, or conduct, or reporting, or dissemination plans of this research.
Provenance and peer review Not commissioned; externally peer reviewed.
Supplemental material This content has been supplied by the author(s). It has not been vetted by BMJ Publishing Group Limited (BMJ) and may not have been peer-reviewed. Any opinions or recommendations discussed are solely those of the author(s) and are not endorsed by BMJ. BMJ disclaims all liability and responsibility arising from any reliance placed on the content. Where the content includes any translated material, BMJ does not warrant the accuracy and reliability of the translations (including but not limited to local regulations, clinical guidelines, terminology, drug names and drug dosages), and is not responsible for any error and/or omissions arising from translation and adaptation or otherwise.