Article Text

Abstract
Introduction The European Environment Agency estimates that 75% of the European population lives in cities. Despite the many advantages of city life, the risks and challenges to health arising from urbanisation need to be addressed in order to tackle the growing burden of disease and health inequalities in cities. This study, Urban environment and health: a cross-sectional multiregional project based on population health surveys in Spain (DAS-EP project), aims to investigate the complex association between the urban environmental exposures (UrbEEs) and health.
Methods and analysis DAS-EP is a Spanish multiregional cross-sectional project that combines population health surveys (PHS) and geographical information systems (GIS) allowing to collect rich individual-level data from 17 000 adult citizens participating in the PHS conducted in the autonomous regions of the Basque Country, Andalusia, and the Valencian Community, and the city of Barcelona in the years 2021–2023. This study focuses on the population living in cities or metropolitan areas with more than 100 000 inhabitants. UrbEEs are described by objective estimates at participants’ home addresses by GIS, and subjective indicators present in PHS. The health outcomes included in the PHS and selected for this study are self-perceived health (general and mental), prevalence of chronic mental disorders, health-related quality of life, consumption of medication for common mental disorders and sleep quality. We aim to further understand the direct and indirect effects between UrbEEs and health, as well as to estimate the impact at the population level, taking respondents’ sociodemographic and socioeconomic characteristics, and lifestyle into consideration.
Ethics and dissemination The study was approved by the regional Research Ethics Committee of the Basque Country (Ethics Committee for Research Involving Medicinal Products in the Basque Country; PI2022138), Andalusia (Biomedical Research Ethics Committee of the Province of Granada; 2078-N-22), Barcelona (CEIC-PSMar; 2022/10667) and the Valencian Community (Ethics Committee for Clinical Research of the Directorate General of Public Health and Center for Advanced Research in Public Health; 20221125/04). The results will be communicated to the general population, health professionals, and institutions through conferences, reports and scientific articles.
- PUBLIC HEALTH
- MENTAL HEALTH
- Health Equity
- EPIDEMIOLOGIC STUDIES
- Quality of Life
This is an open access article distributed in accordance with the Creative Commons Attribution Non Commercial (CC BY-NC 4.0) license, which permits others to distribute, remix, adapt, build upon this work non-commercially, and license their derivative works on different terms, provided the original work is properly cited, appropriate credit is given, any changes made indicated, and the use is non-commercial. See: http://creativecommons.org/licenses/by-nc/4.0/.
Statistics from Altmetric.com
STRENGTHS AND LIMITATIONS OF THIS STUDY
This study protocol describes a multicentric project in Spain with a cross-sectional approach.
The project uses a large volume of data from a large sample of participants.
The project links data of four independent population health surveys and environmental exposures.
Objective and subjective urban environmental exposures are included.
A health equity perspective is addressed.
Introduction
According to the WHO, modifiable environmental factors are responsible for 23% and 22% of the global mortality and morbidity, respectively.1 As reported by the European Environment Agency, in 2021, 75% of the European population lived in urban areas, including cities but also smaller urban settlements and suburban areas, developed for residential, industrial, or recreational purposes.2 The local urban environment influences people’s health by determining their level of urban environmental exposures (UrbEEs).3 4 The UrbEEs include the totality of the surrounding natural (e.g., green and blue spaces), built (e.g., walkability, urbanisation level and traffic), and social (e.g., security and public services) environments within which people live, move and interact, as well as environmental stressors like air pollution and noise. Increasing evidence shows that UrbEEs such as lack of greenness, air pollution and noise can impact population’s mental and physical health and quality of life.5–9 The health implications of environmental exposures become even more relevant in the contemporary demographic setting, given that they are perhaps starker in urban areas.10–14 Moreover, in many regions, environmental exposures are not evenly distributed across socioeconomic status (SES) and thus, socioeconomically vulnerable populations are also affected by poorer environmental quality.10 11 In fact, this double jeopardy may result in individuals from poorer socioeconomic backgrounds being more significantly affected by environmental exposures.4 15 A comprehensive approach is crucial for understanding the interplay of various environmental determinants with health and well-being within urban settings. A holistic multiexposure framework should be adopted, as outlined by Hammersen et al,16 that extends beyond traditional considerations and incorporates critical urban contextual issues such as substandard housing, crowding, economic inequality and the evolving challenges posed by climate change, as well as individual psychosocial factors.17 18
UrbEEs, including environmental stressors, traffic-infrastructure, natural spaces and built environment, have all been studied in relation to health. Widespread evidence in the literature shows that air pollution, noise and lack of green space are related to a range of chronic physical diseases.19–24 Recently, it has been suggested that air pollution is associated with a range of mental disorders and poorer sleep quality.21 25–28 Other recent studies observed that environmental noise has negative effects on mental health, well-being and sleep quality,27 29–31 while evidence on its impact on prescriptions and consumption of medication for common mental disorders has yet to be scientifically confirmed.32 Otherwise, current scientific evidence indicates that residential greenness is positively associated with mental health and quality of life,31 33 34 and lower consumption of anxiolytics, antidepressants and sleeping pills.27 35 Blue spaces (aquatic environments such as rivers, lakes and the coast) are expected to have similar health effects to those described here; however, evidence on this subject is limited.35 36 As for the built environment, walkability or accessibility has also been related to reduced obesity and better cardiovascular health,37 improved mental health38 39 and well-being.40 To date, the main mechanisms proposed to explain these associations are the mitigation of exposure to environmental pollutants, the promotion of physical activity and the strengthening of social cohesion.33 34 37 41–43 Moreover, these mechanisms are probably synergistic.44 The correlations between several UrbEEs and their relationship with behavioural exposures, such as physical activity and social cohesion, make the assessment of these associations and pathways highly challenging.45–49 Hence, noise and air pollution could act both as exposures, mediators or potential confounders. Overall, results of previous studies are quite mixed and the associations as well as the underlying mechanisms between UrbEEs and mental health outcomes need more robust scientific evidence.5 47 50–52
This knowledge gap can be partly explained by the heterogeneity and limitations of exposure and outcome metrics used in the studies.19 52 53 Moreover, there is a lack of studies addressing the impact of UrbEEs on health integrating objective and perceived accounts of such exposures.54 Therefore, it is evident that more research is needed to determine which UrbEEs are associated with health, the potential mechanisms involved and the role of social aspects in those associations. Beyond this, researchers are increasingly called to provide information that can guide the selection of the best and most feasible interventions to improve public health in cities. In this respect, experts in the field have claimed the vital role that health impact assessment tools play when integrating the evidence in the decision-making process.55 56
Urban environment and health: a cross-sectional multiregional project based on population health surveys in Spain (DAS-EP project) is a 3-year project (2023–2025) aimed at further investigating the associations and underlying mechanisms, including direct and indirect effects, between UrbEEs and health with a health equity perspective. Five main objectives have been established for this project:
To estimate, describe and compare the objective and subjective levels of UrbEEs in the study areas.
To describe urban environmental inequalities according to sociodemographic and socioeconomic variables, as well as the study area.
To estimate the association of UrbEEs with self-perceived general and mental health, health-related quality of life, chronic mental disorders, consumption of medication for common mental disorders and sleep quality (figure 1). (For a summary of current prevalence of common mental disorders in Spain, see section 0 in the online supplemental file 1).
To estimate the impact of UrbEEs on the health outcomes under evaluation, at the population level, and to conduct a health impact assessment.
To assess the mediating role of physical activity, social cohesion and environmental stressors on the association between UrbEEs and the health outcomes under evaluation (figure 1).
Supplemental material

Conceptual framework designed within the scope of this project, including potential direct and indirect effects of urban environmental exposures (UrbEEs) on the health outcomes under study. *Potential mediators on the association between UrbEEs and the health outcomes are under evaluation.
The general hypothesis of this research project is that the urban environment directly or indirectly affects mental health and quality of life. In line with the first objective of the project, we expect significant differences in levels of exposure to urban environmental variables among the cities under study. Regarding the second objective, we expect participants with lower socioeconomic status, lower educational levels and less remunerated occupations to live in residential environments of poorer environmental quality. We expect them to live in areas with less availability of green and blue spaces, lower walkability scores and higher levels of noise and air pollution. Finally, we expect the various environmental exposures reported in this study to be significantly associated with the various health and mental health variables studied in the project. Notably, we anticipate that air pollution and noise may have negative effects on mental health, while exposure to natural (green and blue), and more walkable spaces will show protective effects against bad mental health. Furthermore, in line with recent literature, we expect that part of these potential effects on mental health might be produced through increased physical activity and social cohesion.
Methods and analysis
Study design
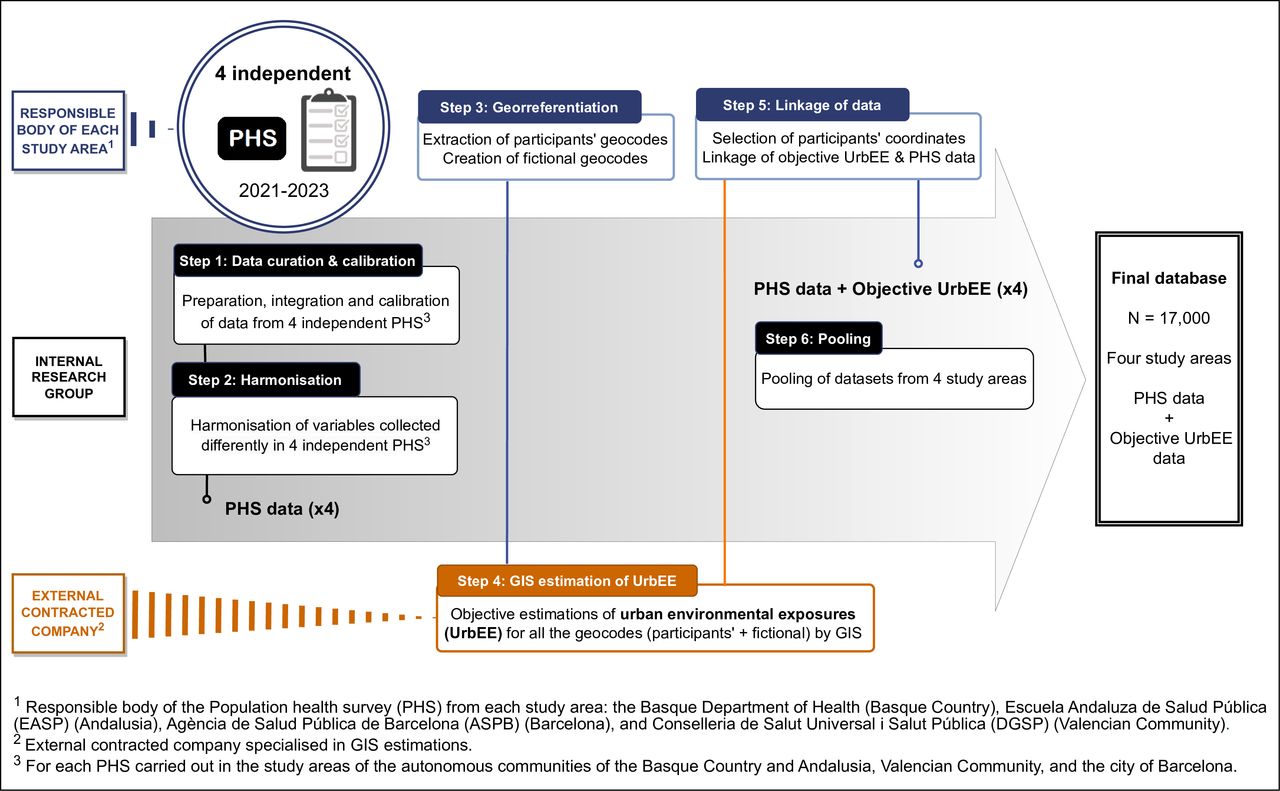
This is a cross-sectional study based on information from population health surveys (PHS) carried out in adult population living in urban areas, with more than 100 000 inhabitants, in the autonomous regions of the Basque Country, Andalusia, the Valencian Community and the city of Barcelona in Spain. The study integrates observational data collected within the four independent PHS in 2021–2023 with geographic information systems (GIS) estimations of individual UrbEEs. It entails the following research activities: (1) preparing, integrating and calibrating PHS data from each study area, (2) harmonising the variables that have been collected differently in the four study areas, (3) georeferencing survey respondents’ home addresses, (4) characterising each home address in terms of UrbEEs by GIS, (5) linking UrbEEs estimates with PHS data and (6) pooling of datasets from the four study areas (figure 2). Using the final pooled database, we will analyse the association between UrbEEs and health in a cross-sectional manner, considering sociodemographic, socioeconomic and lifestyle factors. Figure 1 shows the conceptual framework designed within the scope of this project. DAS-EP received ethics approval from the relevant regional ethics committees (see more online supplemental file 1). This project has received funding from the Instituto de Salud Carlos III under the Strategic Action in Health with the Health Research Fund (FIS) in the call 2022 (file No. PI22/01051 and No. PI22/00512). The project runs from December 2023 to December 2025.

Summary of data management plan and the institutions involved during the development of the final database (DB) to be used by the research group in the analyses.
Study population
The target population are inhabitants of the autonomous communities of the Basque Country, Andalusia, the Valencian Community and the city of Barcelona. The sampling frames are made up of people over 15 or 16 years of age of the respective study areas. The study population includes the PHS’ participants living in urban areas with more than 100 000 inhabitants in the regions mentioned before (online supplemental figures S1 and S2). The cities and metropolitan areas participating in this study are: the city of Vitoria-Gasteiz, and the metropolitan areas of Bilbao and Donostia-San Sebastián in the Basque Country; the cities of Almeria, Cadiz, Cordoba, Huelva, Jaen and the metropolitan areas of Granada, Malaga and Seville in Andalusia; the cities of Castellon, Valencia, Elche and Alicante in the Valencian Community; and the city of Barcelona (online supplemental table S1).
The PHS included in this project are official statistical operations that are incorporated in the statistical plans of each study area. These activities are conducted by every regional or local public administration with jurisdiction in health and are a fundamental tool to monitor the status and evolution of relevant health conditions in the population, their main determinants and the use of health services.57–60 Accordingly, these regional and local cross-sectional epidemiological surveys are carried out by the Basque Department of Health in the Basque Country,57 Andalusian School of Public Health in Andalusia,58 Barcelona Public Health Agency in Barcelona59 and Foundation for the Promotion of Health and Biomedical Research in the Valencian Region in Valencian Community.60 They have been organised every 4–5 years since 1986 (Basque Country), 1999 (Andalusia), 1983 (Barcelona) and 1991 (Valencian Community). The sample design and the selection of the sample are carried out independently in each region by the statistical institute (The Basque Institute for Statistics in the Basque Country, Institute of Statistics and Cartography of Andalusia in Andalusia, and municipal statistical office of the Barcelona city council in Barcelona) or health population information system (Valencian Community). Data from the latest version of these surveys is included in this project. After the surveys are completed, we expect a total estimated sample of 16 953 individuals, of which 7846 participants will be from the Basque Country, 3085 from Andalusia, 3134 from the Valencian Community and 4000 from the city of Barcelona. More detailed information is provided in online supplemental table S1.
Data collection
GIS estimates of UrbEEs
Objective measures of UrbEEs are estimated by a company specialised in GIS based on the geographical coordinates of the participants’ home addresses. A significant number of these variables will be expressed in buffers around each participant’s residence or at the building level. All environmental exposures will be assessed preceding to, and as close as possible to the time the PHS are being conducted (2021–2023) to avoid temporal mismatch.61 The objective UrbEEs of interest in this project include exposures originated from surrounding natural spaces, built environment, traffic infrastructure and environmental stressors. Detailed information on the UrbEEs estimated within the scope of this project can be found in the supplementary file (online supplemental table S2).
Surrounding natural spaces
Green spaces. Five green space exposure metrics will be calculated in buffers of 100, 300 and 500 m around each geocode: (1) percentage of green space; (2) mean Normalised Difference Vegetation Index62 63; (3) percentage of tree cover; (4) Euclidean distance to the nearest green space larger than 5000 m2,64 and (5) presence of a major green area (greater than 5000 m2).
Blue spaces. Any blue environments, including lakes, rivers or coastline will be considered as blue space. Three blue space exposure variables will be estimated: (1) presence of water surface; (2) percentage of water surface; and (3) Euclidean distance to nearest water surface greater than 5000 m2. The first two refer 100, 300 and 500 m buffers around each geocode.65
Built environment
Building density. The building density around each home address in 100, 300 and 500 m buffers will be estimated, considering not only the perimeter of the buildings but also their height.66
Walkability. An overall walkability index in 100, 300 and 500 m buffers around the participants' home addresses will be calculated. This index will include of the following subindices: (1) population density (at the census tract level), (2) street density, (3) street connectivity, (4) land use Shannon Evenness Index, (5) facility richness, (6) facility density, (7) average slope and (8) transport density.67 68
Traffic infrastructure
Major road (Yes vs No). Presence of a major road (with >3 million vehicle passages per year) in 100, 300 and 500 m buffers around the participants' home addresses.66
Distance to major road. Distance to the nearest major road (with >3 million vehicle passages per year) from the participants home addresses.66
Environmental stressors
Air pollution. Spatiotemporal daily models at household level for particulate matter (PM10 and PM2.5) and nitrogen dioxide (NO2) will be constructed for all study areas using multistage mixed models. These models are known as spatiotemporal land-use random-forest model69 and combine ground-level and satellite measurements, land use and meteorology. A precise daily estimate of the exposures will be obtained for all study subjects (period 2006–2023). Using the daily estimates, annual average for the last 5 years and the 5 year average of NO2, PM10 and PM2.5 exposure levels will be calculated at PHS respondents’ home address as indicators for long-term air quality.
Environmental noise. The Strategic Noise Maps derived under the EU Directive 2002/49/EC from the Ministry for the Ecological Transition and the Demographic Challenge will be used. All potential sources of environmental noise at street level will be examined, including road traffic, rail, industrial, airports and total noise.70 71 Major roads, major railways and major airports will be included in cities where this information is available and not included in the agglomeration layer. Agglomerations corresponding to the closest street to the dwelling, and major roads and airports corresponding to the closest isoline will be used. In all cases, the Euclidean distance to each source will also be calculated. The daytime (Ld), evening (Le), night-time (Ln) and total (Lden) noise indices will be assigned.
Contextual socioeconomic variables
Neighbourhood-level SES will be considered via three variables, namely, mean income, income distribution P80/P20, and the MEDEA deprivation index (constructed within the project "Mortalidad en áreas pequeñas Españolas y Desigualdades Socioeconómicas y Ambientales [MEDEA]", and composed by percentage of the population with manual labour, percentage of the population with casual labour, percentage of the population unemployed, percentage of the population with insufficient education, percentage of the population of young people with insufficient education).72 All these metrics will be obtained from the publicly available data developed by the Spanish National Institute for Statistics and expressed at the census tract level (online supplemental table S3).
Individual sociodemographic and socioeconomic variables
To describe respondents’ individual-level SES, eight variables will be selected: country of birth, marital status, household size, level of education, employment and occupational status, reported household income and economic difficulty of the household (online supplemental table S4)
Information collected through PHS
Information from four independent PHS that represent four study areas is included in the study. The surveys were carried out between 2021 and 2023, being Barcelona city the earliest in completing the collection (February 2021–March 2022), followed by the Valencian Community (April 2022–December 2022), Andalusia (April 2022–April 2023) and the Basque Country (October 2022–June 2023) (online supplemental table S1). During each survey, detailed information is collected though face-to-face interviews and self-administered questionnaires. The PHS collect information on different health aspects, morbidity and use of health services. It also gathers information on social determinants of health such as socioeconomic status, working conditions, social cohesion, health-related behaviours and perceptions on residential environment. Most of these variables are measured with validated screening tools. The selection of relevant variables to be included in this project was based on a literature review and the most appropriate variables to meet the objectives of the study were selected from among the variables collected by the PHS. All the study areas collected the main variables of the study (ie, mental health, health-related quality of life, physical activity, social cohesion, and sleep); however, in some cases, the measuring instruments differ across the study areas. Detailed information about the variables and the measuring instruments used in each study area can be found in online supplemental table S4.
Health outcomes
Several health outcome variables are included in this study.
Perceived general health. Self-assessment of health was measured as an ordinal response, with five categories (1, Excellent; 2, Very good; 3, Good; 4, Fair; 5, Poor).
Perceived mental health. This variable was collected with the Mental Health Inventory,73 the Short-Form Health Survey 12 (SF-12) scale74 or the 12-item General Health Questionnaire.75
Health-related quality of life. This variable was measured with the 5-level EuroQol 5-dimension visual analogue (EQ-5D-5L-VAS) scale76 or the SF-12 scale.74
Sleep duration and quality. The duration of sleep, indicated as the total number of hours per day spent on sleep including napping, was calculated. The quality of sleep was collected using the Satisfaction Alertness Timing Efficiency and Duration Scale (SATED) scale77 or discrete items.
Prevalence of chronic mental health problems. Participants had to indicate whether they had been diagnosed with depression, anxiety and sleeping disorders at any time throughout the life. We then built a dichotomised (yes/no) variable for each condition.
Consumption of medication for common mental disorders. Information on consumption of medication for common mental disorders, such as anxiolytics, antidepressants and hypnotics, was reported on bidaily or biweekly basis depending on the study area.
Covariates
A set of individual-level variables will be used as control variables in the statistical analyses.
Anthropometric variables. The surveys collect information on sex, age, weight and height of individuals. A body mass index (kg/m2) will be calculated using information given by the participants about their height and weight at the moment of filling the questionnaire.
Individual sociodemographic and socioeconomic variables. To describe respondents’ individual-level SES, eight variables will be selected: country of birth, marital status, household size, level of education, employment and occupational status, reported household income and economic difficulty of the household.
Lifestyle factors. These will include consumption habits such as alcohol consumption, passive smoking at home and tobacco use.
Physical health. A chronicity index will be calculated based on the presence of one or more non-psychological chronic conditions (e.g., diabetes, heart disease, cancer, etc).
The following social and behavioural variables will be treated as potential mediators.
Social cohesion and loneliness. Social cohesion is measured with the functional social support questionnaire 11-item Duke-UNC (Duke-UNC-11) scale78 or the 3-item Oslo Social Support (OSLO-3) tool.79 Perceived loneliness is collected with a single item for participants to report about the frequency in which they feel loneliness. The variable is displayed in a 1 to 4 (1=always; 2=often; 3=sometimes; 4=never) response scale.
Physical activity. The International Physical Activity Questionnaire80 to measure the physical activity performed by the participants. Days per week and time spent in vigorous physical activity, in moderate physical activity, and walking more than 10 min, and time spent sitting on a normal day will be available.
Perception of the neighbourhood
Perceived accounts of UrbEEs are collected through PHS employing 3-point or 5-point Likert format questions depending on the study area. These include (1) perception of noise outside the dwelling, (2) perception of shortage of green areas in the residential environment, (3) perception of air pollution in the residential environment and (4) perception of insecurity in the neighbourhood.
Data analysis
Initially, all databases will be cleaned. The variables will be harmonised, when needed, following the Maelstrom Research Guidelines for rigorous harmonisation of retrospective data.81 Nonetheless, because most variables have already been collected consistently in the respective PHS, few variables will require harmonisation (online supplemental table S4). Among the few variables requiring harmonisation, most will be recategorised. For more information, see online supplemental file 5. Subsequently, both exploratory and descriptive analysis will be applied using numerical and graphical techniques.82 Before proceeding to inference, sample weights for each survey will be adjusted through calibration,83 so that we may compensate for non-response and coverage biases and improve accuracy. This calibration will be carried out separately for each study area, so that region-level estimates are obtained first, and then harmonised to obtain estimates at population level.
The relationships between the various UrbEEs and health outcomes will be analysed according to the multilevel, or hierarchical structure84 that the data possesses, as census tracts are nested within cities, and cities are nested within autonomous regions. Generalised linear mixed models will be applied to investigate the relationship between urban environment and health. The sets of adjustment covariates used in these models will be chosen by applying robust causal inference techniques based on directed acyclic graphs (DAGs),85 both for the estimation of direct effects and hypothetical indirect effects mediated by air pollution, environmental noise, physical activity and social cohesion. This will imply the prior design of a DAG describing the relationships among UrbEEs, health outcomes and other potentially implicated variables.86 87 The testable implications derived from this DAG will be checked following the procedure described by Ankan et al,88 thereby updating the DAG if needed.89 90 These graphical models will guide the inclusion of relevant sociodemographic and socioeconomic variables, allowing us to account for potential confounding factors and illuminate causal relationships. The length of time living in the same home/place will be considered by excluding individuals living at the same place of residence for less than 1 and less than 5 years in separate models. Equity will be addressed by performing subgroup analysis to investigate potential vulnerable groups such as lower-income populations, the elderly, women and marginalised communities.
In case of demonstrating a significant relationship between a given exposure and a certain outcome, we also intend to identify the specific exposures that cause most disease in the populations of interest via the population attributable fraction (PAF).91 To estimate the PAF, we will require previous estimations of relative risk and either the prevalence of exposure in the population or the prevalence of exposure among the cases of disease. All these previous estimates will be available. The possible existence of spatial clusters in the UrbEEs distribution will also be studied using the standard spatial scan statistic method92 and calculating the posteriori probabilities for the smoothed standardised ratios to be greater than unity, in the general framework of Bayesian hierarchical standardised ratio smoothing models.
The analyses will be implemented using the latest version of the R software packages dagitty,85 DClusterm,93 94 R INLA,95 Sampling96 and others.
Data management plan
The data management plan can be found in the online supplemental file 5. The source and type of data that will be collected within the scope of this project are described in this plan, together with the accessibility and ownership of data. Data storage and processing, as well as the procedure to guarantee the specific ethical and legal requirements, are likewise explained.
Patient and public involvement
Patients and the public will not be involved in the design, or conduct, or reporting or dissemination plans of our research.
Discussion
The present study is a clear commitment to the generation of urban environmental indicators potentially explanatory of self-perceived health (physical and mental), chronic mental disorders, health-related quality of life, consumption of medication for common mental disorders and sleep quality with a health equity perspective. This project responds to the national Spanish Strategic Plan for Health and the Environment 2022–2026,97 to the local implementation of the Strategy for Health Promotion and Prevention in the National Health System98 as well as to the main objective of the Spanish Urban Agenda 201999 that cities should have a global vision that takes into consideration the physical, mental and social well-being of their inhabitants. Likewise, it is aligned with three of the sustainable development goals (SDG) of the WHO (SDG.3—Good Health and Well-being, SDG.10—Reduced Inequalities and SDG.11—Sustainable Cities and Communities).97 98
When it comes to health-promoting urban and transport design, there is a lack of standardised, quantitative indicators to guide the integration of health components right from the outset.57 100 In this context, the DAS-EP project not only aims to obtain individual UrbEEs estimates but also to assess their association with, and impact on various health outcomes. By means of PHS, the health effects to be studied in this project are derived from an unbiased population, which allow us to obtain an approximate estimate of the impact at population level. Moreover, it is important to identify the precise routes that connect urban environment to health because they can guide the most efficient interventions, allowing us to design healthy(er) cities.55 101 In this sense, the DAS-EP project investigates various components of the urban environment and health at individual level. In addition tousing complementary indicators that describe both the physical and the social urban environment (e.g., neighbourhood insecurity), the DAS-EP project combines objective and perceived indicators to deepen the characterisation of the urban environment. By combining these data, it is possible to develop a more precise understanding of the effects of urban environment on health, while describing the complexity of the relationship influenced by neighbourhood environmental and individual characteristics.102–104
The main limitation of this study is its cross-sectional nature. Due to the chronic character of the health conditions included in the study (e.g., depression, insomnia) and the possible long-term effects of UrbEEs, a longitudinal design would be more informative and appropriate. Although PHS have a cross-sectional approach, the question ‘since when have you been living at your current address’ enables accounting for the extent of exposures. Drawing on these mobility data, sensitivity analysis of the models will be fitted reducing the risk of exposure misclassification. Another limitation is that the samples from the study areas of the Basque Country, Andalusia and Valencian community, although representative of the study population (considering the inclusion criteria) may not be representative of the autonomous communities from which they come as we are not considering the non-urban municipalities (<100 000 inhabitants). Despite the weight calibration to be conducted to reduce coverage and representativeness biases, the reweighing procedure will not guarantee the elimination of other response biases that may affect data collection from PHS (as acquiescence, social desirability, etc) which could affect the validity of the results.105 106 Furthermore, the project is subject to residual confounding, which in turn implies confounders that could not be controlled and, importantly, measurement errors in the confounders that have been included. In this regard, the estimation UrbEEs by GIS is affected by the problem of uncertainty of the temporal and geographical context.107
The use of buffer zones may not be appropriate to evaluate contextual effects on health because they fail to analyse the spatial–temporal distribution of residents’ activities and their relationship with built environment factors. Using activity space measures would be preferable to comprehensively assess of environmental exposures by capturing the complexity of individual movements.108–110 The reliance on publicly available data applicable to all study areas together with scalability challenges were major barriers to estimate street-level (or microscale) variables like bicycle and pedestrian infrastructure.111–113 Moreover, future studies should not only include more variables reflecting the social capital (e.g., perceived sense of community) but also analyse the health implications of other relevant urban exposures like substandard housing, crowding and indoor air pollution. Finally, the heterogeneity across study areas in terms of geographic scale (autonomous communities vs city) may be a source of information bias. In this vein, the majority—but not all—of the scales and variables included in the different PHS are identical. These minor differences in data collection across PHS may lead to additional information biases hindering the comparability of the data. To minimise this problem, special attention will be paid to the selection and harmonisation of the variables to be included to ensure the consistency of data before making the comparisons across study areas.
As for the strengths of this project, pooling linked surveys across study areas will make it possible to compare the results in different populations, providing a comprehensive dataset that is larger than most existing cohort studies, and that have an unique national and population perspective. The results will be novel in terms of their thematic (objective and subjective UrbEEs) and methodological approach (combination of PHS from different study areas and GIS estimates), as well as in terms of the large volume of information that will be handled and the large sample size of the study. Beyond that, the standardisation of the procedure described herein will generate useful information to assist in the planning of national health surveillance programmes, research studies and, more importantly, interventions to strengthen population’s health.
In short, the results and products (ie, databases, computer codes) of this project will greatly contribute to estimate the proportion of the population exposed to different UrbEEs, identify health disparities while considering UrbEEs, estimate how these exposures relate to and affect various health variables, and conduct a health impact assessment of UrbEEs. We will have taken a further step towards understanding and improving the urban environment and being able to establish corrective measures in the urban development plans of the cities.
Ethics and dissemination
The study was approved by the regional Research Ethics Committee of the Basque Country, Ethics Committee for Research Involving Medicinal Products in the Basque Country (protocol code PI2022138, dated 9 November 2022); Andalusia, Biomedical Research Ethics Committee of the Province of Granada (protocol code 2078-N-22, dated 27 December 2022); Barcelona, Parc De Salut Mar Clinical Research Ethics Committe (protocol code 2022/10667, dated 2 December 2022); Valencian Community, Ethics Committee for Clinical Research of the Directorate General of Public Health and Center for Advanced Research in Public Health (protocol code 20221125/04, dated 25 November 2022). The results will be communicated to the general population, health professionals and institutions through conferences, reports and scientific articles.
Ethics statements
Patient consent for publication
Acknowledgments
We thank all institutions (Basque Department of Health in the Basque Country, Andalusian School of Public Health (EASP) in Andalusia, Barcelona Public Health Agency (ASPB) in Barcelona, and Foundation for the Promotion of Health and Biomedical Research in the Valencian Region (DGSP) in Valencian Community) developing the Population Health Surveys that are used in this project.
References
Supplementary materials
Supplementary Data
This web only file has been produced by the BMJ Publishing Group from an electronic file supplied by the author(s) and has not been edited for content.
Footnotes
Twitter @acabreraleon
Contributors Conceptualisation, methodology, funding acquisition: AL, AC-L and MS-P. Writing, original draft preparation, project administration: AB, AL, MS-P and AC-L. Writing, review and editing: all authors. All authors have read and agreed to the published version of the manuscript.
Funding This study has been funded by Instituto de Salud Carlos III (ISCIII) through the projects "PI22/01051" “PI22/00512 and cofunded by the European Union. Data collection is funded by the various agencies responsible for the included health surveys. In addition to this funding, the group has its own financial means for other expenses including publication and dissemination of results, travel expenses and conference registrations related to the study.
Map disclaimer The inclusion of any map (including the depiction of any boundaries therein), or of any geographical or locational reference, does not imply the expression of any opinion whatsoever on the part of BMJ concerning the legal status of any country, territory, jurisdiction or area or of its authorities. Any such expression remains solely that of the relevant source and is not endorsed by BMJ. Maps are provided without any warranty of any kind, either express or implied.
Competing interests None declared.
Patient and public involvement Patients and/or the public were not involved in the design, or conduct, or reporting, or dissemination plans of this research.
Provenance and peer review Not commissioned; externally peer reviewed.
Supplemental material This content has been supplied by the author(s). It has not been vetted by BMJ Publishing Group Limited (BMJ) and may not have been peer-reviewed. Any opinions or recommendations discussed are solely those of the author(s) and are not endorsed by BMJ. BMJ disclaims all liability and responsibility arising from any reliance placed on the content. Where the content includes any translated material, BMJ does not warrant the accuracy and reliability of the translations (including but not limited to local regulations, clinical guidelines, terminology, drug names and drug dosages), and is not responsible for any error and/or omissions arising from translation and adaptation or otherwise.