Article Text

Abstract
Objectives The application of artificial intelligence (AI) to the field of pathology has facilitated the development of digital pathology, hence, making AI-assisted diagnosis possible. Due to the variety of lung cancers and the subjectivity of manual evaluation, invasive non-mucinous lung adenocarcinoma (ADC) is difficult to diagnose. We aim to offer a deep learning solution that automatically classifies invasive non-mucinous lung ADC histological subtypes.
Design For this investigation, 523 whole-slide images (WSIs) were obtained. We divided 376 of the WSIs at random for model training. According to WHO diagnostic criteria, six histological components of invasive non-mucinous lung ADC, comprising lepidic, papillary, acinar, solid, micropapillary and cribriform arrangements, were annotated at the pixel level and employed as the predicting target. We constructed the deep learning model using DeepLab v3, and used 27 WSIs for model validation and the remaining 120 WSIs for testing. The predictions were analysed by senior pathologists.
Results The model could accurately predict the predominant subtype and the majority of minor subtypes and has achieved good performance. Except for acinar, the area under the curve of the model was larger than 0.8 for all the subtypes. Meanwhile, the model was able to generate pathological reports. The NDCG scores were greater than 75%. Through the analysis of feature maps and incidents of model misdiagnosis, we discovered that the deep learning model was consistent with the thought process of pathologists and revealed better performance in recognising minor lesions.
Conclusions The findings of the deep learning model for predicting the major and minor subtypes of invasive non-mucinous lung ADC are favourable. Its appearance and sensitivity to tiny lesions can be of great assistance to pathologists.
- computational pathology
- lung cancer
- adenocarcinoma
- digital pathology
- deep learning
Data availability statement
Data are available upon reasonable request.
Data availability statement
Data are available upon request to the corresponding authors.
This is an open access article distributed in accordance with the Creative Commons Attribution Non Commercial (CC BY-NC 4.0) license, which permits others to distribute, remix, adapt, build upon this work non-commercially, and license their derivative works on different terms, provided the original work is properly cited, appropriate credit is given, any changes made indicated, and the use is non-commercial. See: http://creativecommons.org/licenses/by-nc/4.0/.
Statistics from Altmetric.com
STRENGTHS AND LIMITATIONS OF THIS STUDY
The deep learning model based on DeepLab v3 with ResNet-50 was trained on a substantial dataset from distinct lung cancer patients and tested using evaluation metrics including macro average and normalised discounted cumulative gain.
Pixel-level annotation by attending pathologists guaranteed accurate and detailed labelling of histological subtypes, ensuring better performance in recognising minor lesions, which can be challenging for human pathologists due to their small size and subtle characteristics.
Artefacts caused by iatrogenic atelectasis or other reasons during surgical specimen processing may affect the recognition accuracy.
The specimens can only represent a limited part of lung adenocarcinoma in practical work, and the performance of this diagnostic model in small biopsies cannot be determined at present.
Introduction
Lung cancer is the second most commonly diagnosed cancer worldwide, but it is the leading cause of cancer-related mortality, accounting for 18.0% of all cancer deaths.1 Among the different subtypes of lung cancer, adenocarcinoma (ADC) is the most prevalent, comprising 40%–45% of all cases.2 The WHO classifies invasive non-mucinous ADC into complex structural patterns, including lepidic, acinar, papillary, solid and micropapillary. Accurate identification of these structural patterns in clinical diagnosis is crucial, as they have been shown to be independent prognostic factors for relapse-free and overall survival. High-grade patterns such as solid, micropapillary, cribriform and complex glandular components are associated with poorer prognosis compared with acinar, papillary and lepidic subtypes.3
In clinical practice, pathologists must meticulously inspect and evaluate all sections of each case to determine the composition and proportion of histological subtypes. However, this process is labour-intensive, time-consuming and subjective. Despite efforts to standardise guidelines and provide systematic training to increase diagnostic consistency, histopathology analysis is inherently limited by the subjective nature of human perception, variability in data integration and judgement among pathologists, even with similar training. This multifactorial and complex problem poses challenges that are difficult to overcome. The emergence of artificial intelligence (AI) offers a new approach to tackle this issue. While AI’s ability to automatically extract morphological features from tissue samples is still constrained by sampling problems and tumour heterogeneity, it has the potential to reduce the impact of subjective visual evaluation and provide more objective results due to its strong data integration capabilities.4 5 With the advancement of digital scanning technology,6 7 whole-slide images (WSIs) have become a vast data repository for AI-assisted pathology systems. In recent years, AI has demonstrated remarkable success in image classification and segmentation,8 leading to the development of sophisticated diagnostic systems based on deep learning.9–14 In the field of histological diagnostics, promising results have been achieved using AI for the detection of malignant tumours in WSIs of various organs, including the lung,15 stomach,16 colon,17 prostate,18–23 lymph nodes,24–27 etc.
A lung ADC WSI may contain up to six subtypes, including lepidic, acinar, papillary, solid, micropapillary and cribriform. Classifying the histological subtype of non-mucinous ADC is a multi-classification task, as opposed to the normal method of determining whether a patient has tumours. In this study, we developed a multi-classification model for histological subtypes of non-mucinous lung ADC that was trained and evaluated using 523 pathological slides. The model was constructed using DeepLab v3 with ResNet-50 backbone.28 The overall precision was 0.88, and the normalised discounted cumulative gain (NDCG) score reached 81.8% (Top k+1).
Methods
Data construction
To build and evaluate the deep learning model, we gathered 523 H&E-stained slides from distinct lung cancer patients at Beijing Chest Hospital. These samples contained all histological subtypes of non-mucinous lung ADC (lepidic, acinar, papillary, solid, micropapillary and cribriform) and were scanned by BioPic CR SA120 at 400× magnification (0.15 μm/pixel). Each WSI has no more than six histological subtypes. Figure 1A depicts the histological subtype distribution of all the WSIs. On the X-axis, each cylinder represents a WSI. The various hues along the Y-axis of each cylinder represent distinct histological subtypes. We can simply determine the proportion of subtypes within each WSI. We randomly allocated 376 for training, 27 for validation and 120 WSIs for testing.

(A) Histological subtype distribution of all the whole- slide images. (B) Overview of the pipeline for identifying histological subtypes of non-mucinous lung adenocarcinoma.
Data annotation
On 523 WSIs, the attending pathologist at Beijing Chest Hospital performed pixel-level annotation. The annotation procedure consists of two phases: initial labelling and second review. First, a pathologist was allocated a WSI at random, and once labelling was complete, the WSI was passed to a second pathologist for examination. In addition, each WSI was labelled with additional histological subtypes and the percentage of each subtype.
Data preprocessing
During the data preprocessing phase, we received sets of curve coordinates without a fixed stroke order, which we then closed and filled at the pixel level. When filling nested curves, external curves are prioritised. During the training procedure, Otsu’s approach is used for the thumbnails of each WSI to extract the tissue region, and the WSI was divided into 320×320-pixel image patches at 200× magnification (0.30 μm/pixel), yielding 571 677 training patches.
Deep learning model
Based on DeepLab v3 with ResNet-50, we improved the model structure. We eliminated image-level characteristics from image pooling. In atrous spatial pyramid pooling, there is one 1×1 convolution and six 3×3 convolutions with atrous rates (2, 4, 6, 8, 10, 12) and an output stride of 16.
Since histopathological slides have no particular orientation, we augmented the training data using random rotation and mirroring. We further randomise the image’s brightness, contrast, hue (average colour) and saturation, as well as colour jittering and blurring. On an Ubuntu server with two Nvidia GTX1080Ti GPUs, all models were trained and evaluated using TensorFlow. To train the models, we used the ADAM optimizer with a fixed learning rate of 0.001. The batch size was set to 32 (16 per GPU) and training was terminated after 25 iterations. To preserve environmental information in the area surrounding the image patches, during the testing phase, we increased each image patch by 10%, from 2000×2000 to 2200×2200 pixels, using the overlapping methodology.
As illustrated in figure 1B, the model provides seven probability maps for each WSI (six subtypes and non-cancer). The probability reflects the likelihood that the pixel at the current position corresponds to the anticipated label. As a final outcome, we take the maximum probability at each pixel from all the probability maps. The list of probable histological subtypes of non-mucinous ADC is derived by counting and sorting all pixel labels.
Evaluation metrics
We selected two evaluation measures to describe the performance of the model, namely, macro average29 and NDCG.30
On the basis of the confusion matrix, it is simple to define and calculate several evaluation metrics for binary classification, including accuracy, sensitivity and specificity.
 (1)
(1)
 (2)
(2)
 (3)
(3)
where TP, FP, TN and FN stand for true positive, false positive, true negative, and false negative, respectively.
However, these single-class evaluation matrices are not indicative of the overall performance of a multi-classification model. The macro average calculates the metric for each class and then uses the mean to indicate the model performance. It is ideally suited for evaluating the performance of multi-classification models.
 (4)
(4)
 (5)
(5)
 (6)
(6)
where n denotes the class number. The macro average takes into consideration all classes and reduces the impact of extreme value instances on model performance.
The label information in the test data and the predicted outcomes are both sorted lists of histological subtypes and their proportional area coverage. To determine the accuracy of this prediction list, we employ NDCG. NDCG is commonly used in search and recommendation tasks as an evaluation metric for ranking results. It is a modified version of the cumulative gain (CG) and the discounted cumulative gain (DCG). CG is the sum of the relevance scores of all documents in the search result list. However, CG only considers the relevance of documents and ignores the position factor. Given a sorted list of length k, the CG is defined as:
 (7)
(7)
where  represents the relevance score of the documents at position i.
DCG is proposed to impose a penalty on the evaluation score when documents with high relevance appear in the lower position of the search result list. The penalty factor is related to the log value of the document location. Given a sorted list of length k, DCG is defined as:
 (8)
(8)
where  is the penalty factor. Its aim is to make the high-ranked documents have a greater impact on the final score.
  is a function to increase the effect of document correlation on the final score. However, the length of the list of different WSIs is different. The DCG values calculated are not comparable. Therefore, we need to normalise the DCG. We calculate the DCG value of an optimally sorted list, expressed as ideal DCG (IDCG). Then we normalised the DCG of the predicted results with IDCG:
 (9)
(9)
Finally, the mean NDCG value is used to assess the accuracy of the model’s predictions. In this research, Top k+N is used to calculate the model’s NDCG, where N is a positive integer.
Patient and public involvement
No patients involved.
Results
Model performance
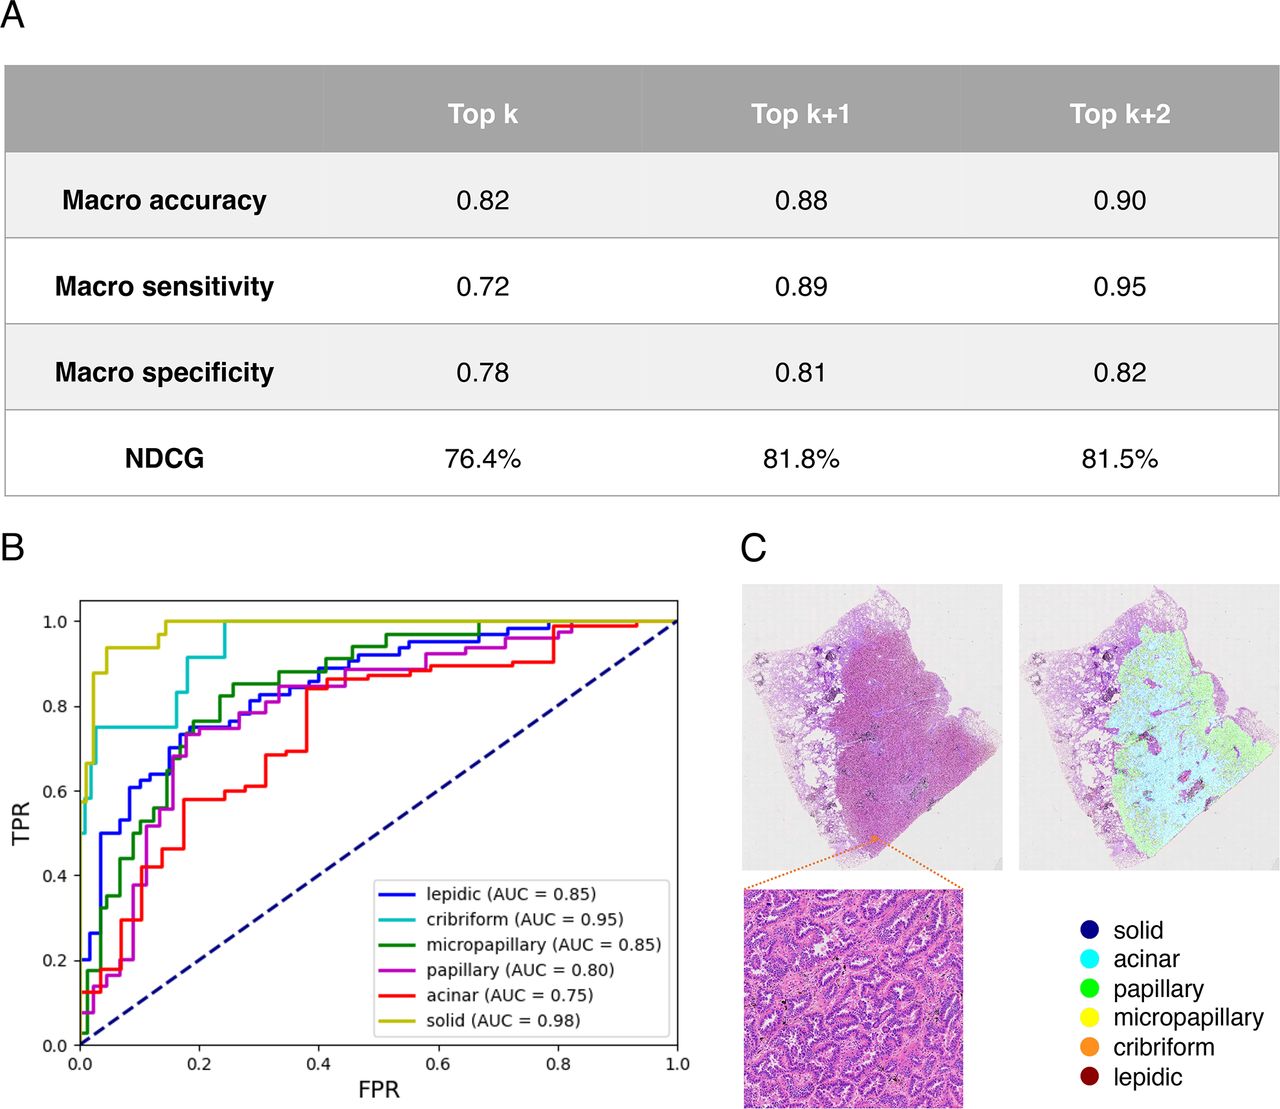
The 120 WSIs in the test set were used to evaluate our model. The model’s performance is listed in detail in figure 2. Figure 2A displays the model’s overall performance. The length of the true label list is k. Top k indicates that the first k values from the prediction label list are selected to calculate metrics. Top k+1 indicates selecting the initial (k+1) values. Except for macro specificity, the Top k+1 and Top k+2 metrics are near 0.9, indicating that the model has excellent classification performance. All NDCG scores are greater than 75%. This indicates the model accurately predicts the predominant subtype and the majority of minor subtypes. Figure 2B depicts the receiver operating characteristic (ROC) curves generated by the model for each histological class. The area under the ROC curve (AUC) of the model was larger than or equal to 0.8 for all classes besides acinar. This suggests that the model performs well in the majority of classes. Poor performance in some classes may be attributable to poor sample quality or a small sample size. The dataset can be refined to enhance the situation.

(A) Overall performance of the model. (B) Receiver operating characteristic (ROC) curves on the test set. (C) The deep learning model correctly detected the minor subtype missed by pathologists. AUC, area under the ROC curve; NCDG, normalised discounted cumulative gain.
Manual analysis
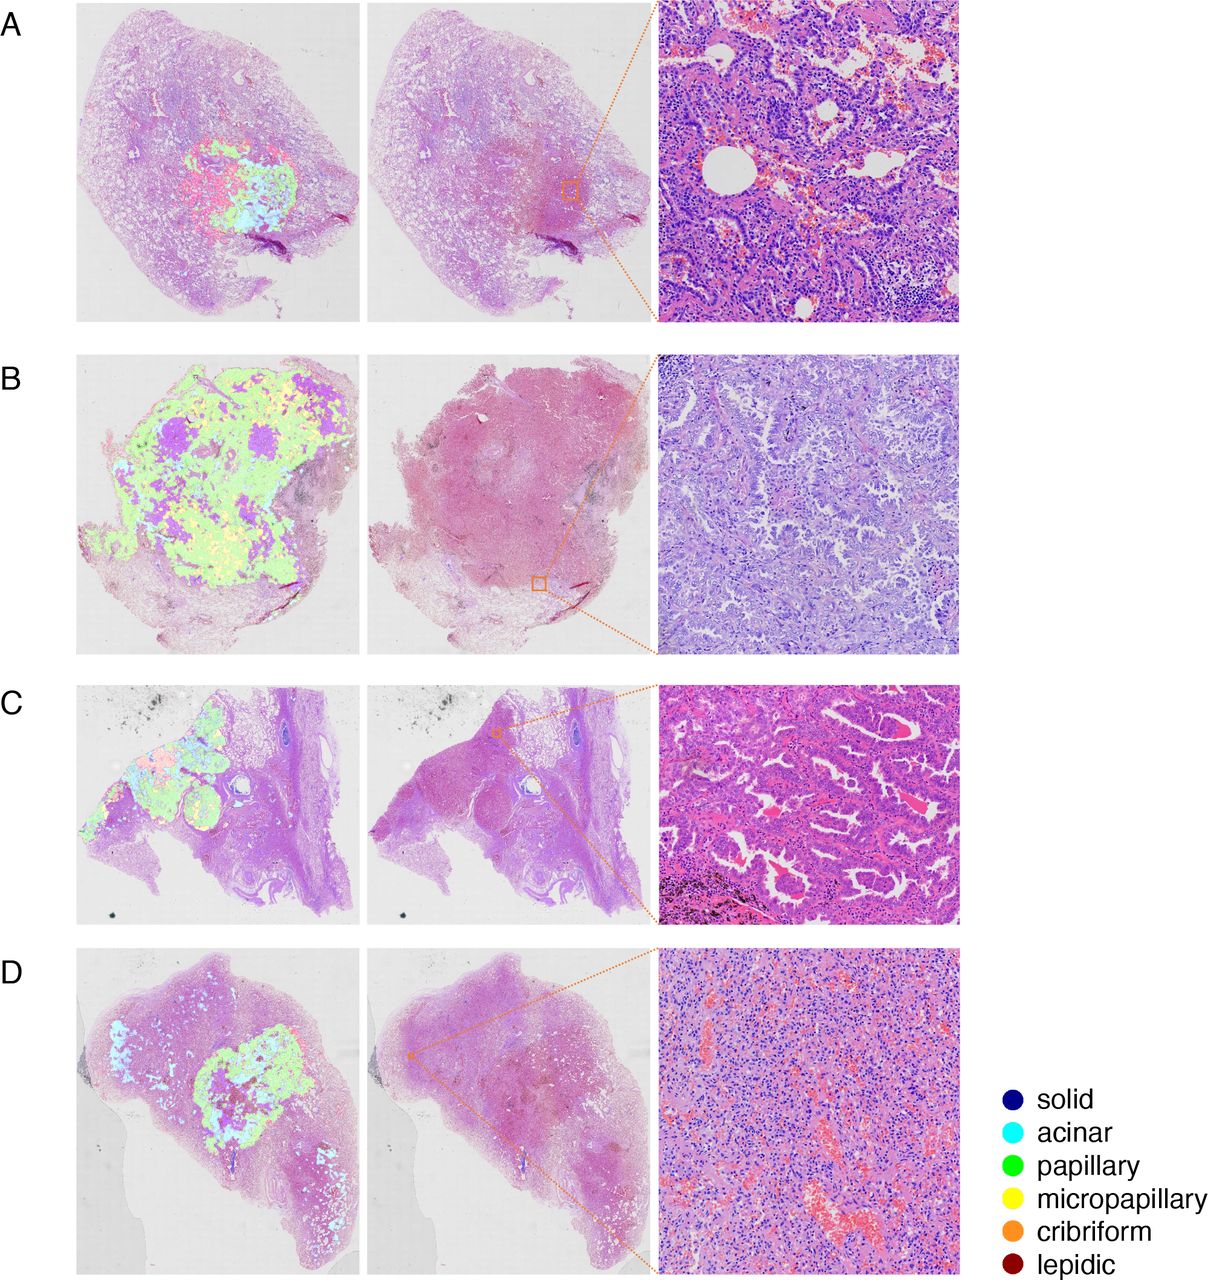
By analysing the model predictions, as illustrated in figure 2C, senior pathologists determined that the model had a high degree of accuracy in detecting the cancerous region and the minor pathological subtypes. In the two situations depicted in figure 3A,B the model accurately identified the cancerous region in both instances. In figure 3A, the lung tissue beneath the cancerous spot is more constricted and the staining is deeper than in the surrounding normal lung tissue. At low magnification, the region was often mistaken for cancerous tissue, but the model accurately identified it as normal. In addition, the vascular region and fibrous tissue hyperplasia region in the middle of the tumour tissue were correctly identified. Both instances were constituted primarily of papillary components, while the acinar and lepidic were intermingled with other components. In routine practice, it was difficult to recognise each subtype immediately. However, it was easy to determine the predominant histological subtype of this case according to the model prediction based on the proportion of each colour.

Model prediction examples.
In figure 3C, there are six components, indicating an adenocarcinoma case with complicated components. To distinguish each subtype in a daily diagnosis, close observation of each region of the slide and a thorough comparison were required to ascertain all subtypes and their proportions. This was a time-consuming task that posed a difficult challenge for pathologists. However, with the model prediction, we could intuitively read out the subtypes and proportions, saving a significant deal of time.
Discussion
Lung cancer poses a significant health risk due to its high prevalence worldwide.1 Among the diverse pathological subtypes of lung cancer, ADC is the most common and has multiple subtypes. In this study, 523 cases were analysed, with 165 cases predominantly exhibiting papillary components, which is consistent with previous studies31 showing higher prevalence of papillary components in Asian populations. Histopathological classification plays a crucial role in determining prognosis, as the presence of micropapillary, solid and cribriform structures often indicate a poor prognosis. Furthermore, different histological subtypes of lung cancer may exhibit specific molecular changes, such as ALK rearrangement being closely associated with acinar and/or solid growth patterns, and statistical associations between KRAS mutations and predominantly solid pattern tumours, as well as estimated glomerular filtration rate mutations and lepidic-dominated non-mucinous ADCs.3 The integration of morphological assessment alongside molecular analysis enhances the accuracy and completeness of the diagnostic process and aids in formulating appropriate treatment strategies tailored to individual patients.
It is crucial for pathologists to appropriately diagnose lung ADC. With the advancement of AI in the field of pathology, the transition from qualitative to quantitative pathological diagnosis has been accelerated, making the diagnosis more objective and precise. Currently, computer-aided diagnosis technology is widely used in cytological screening, tumour grade assessment and tumour prognosis evaluation, and it has also yielded promising findings in the research of histological subtypes32 and prognosis analysis33 of lung cancer. Using deep learning techniques, such as a deep convolutional neural network, researchers have classified subtypes of lung cancer based on histopathology specimens. Coudray et al developed a model that accurately classified WSIs from The Cancer Genome Atlas as ADC, squamous cell carcinoma, or normal lung tissue, with performance comparable to that of a pathologist, with an average AUC of 0.97.15 In another pioneering study, Wei et al used a residual neural network to automatically classify histological subtypes of lung ADC from surgical resection slides. The model identified and aggregated classification results from patches obtained from the entire slide, enabling the inference of major and minor histological patterns for any given WSI.34 It achieved a kappa score of 0.525 and an agreement of 66.6% with three pathologists for classifying the predominant patterns.
The successful development of AI in pathology requires collaboration between computer scientists and pathologists. Computer scientists provide technical expertise while pathologists contribute the initial image data and learning criteria for AI training. Thus, the proficiency of pathologists in diagnostic criteria is crucial for the success of AI learning models. Variability in the consistency and interpretation of subtypes of lung ADC and invasion among different observers has been reported in previous studies, particularly in lepidic, papillary and acinar components.4 35 36 Factors such as collapsed alveoli and transition zones with extensive epithelial proliferation can also contribute to differences in interpretation. To improve consistency, pathologists involved in labelling were uniformly trained to standardise diagnoses.
During the labelling process, similar challenges were encountered as in previous studies, as shown in figure 4, where (A), (B) and (C) represent typical acinar, papillary and lepidic components, respectively. However, alveolar collapse shown in figure 4D sometimes resembles lepidic components, and differential staining techniques such as elastin and cytokeratin seven staining, as well as the presence of interstitial infiltration of chronic inflammatory cells and macrophages in the alveolar cavity, can aid in distinguishing between the two.36 Additionally, in figure 4E, acinar and papillary components are mixed, making it challenging to distinguish them accurately, resulting in potential confusion during the labelling process. In such cases, ambiguous areas were ignored, and more typical and consistent areas were chosen as templates for AI training.

(A) Acinar component. (B) Papillary components. (C) Lepidic components. (D) Alveolar collapse. (E) Acinar and papillary components.
On comparing the tumour regions and subtypes automatically identified by the AI model with pathologist annotations, it was observed that the model had high recognition accuracy for major subtypes, although there were some differences in identification range or proportion of each subtype. For example, there were excessive papillary patterns but fewer lepidic and micropapillary patterns. As illustrated in figure 5A, the difficulty in differentiating papillary and lepidic components was evident. The model recognised three components, including lepidic, acinar and papillary, whereas manual assessment indicated only two components, lepidic and acinar. Papillary ADC is characterised by tumour cells lining the interstitial surface with a fibrovascular core, forming a papillary structure with secondary and tertiary branches, while lepidic tumour cells line the surface of alveolar walls.3 However, due to the limitations of the pathological sections, the alveolar cavity may not be fully represented, resulting in a blind end that resembles the papillary appearance, leading to misidentification of the lepidic component as papillary by the AI model. Conventionally, interstitial components of lepidic ADCs are thin, while those of papillary ADCs are more complex. However, the AI model relies solely on morphological features, which may pose challenges in accurately discerning such details.

(A) Lepidic components were misdiagnosed as papillary components. (B) Macrophages misidentified as micropapillary. (C) Micropapillary was not detected when coexisting with papillary or acinar components. (D) A false positive case.
Figure 5B,C illustrates the difficulty in detecting micropapillary components. In figure 5B, the model incorrectly labels clusters of macrophages and sloughed epithelium in the alveolar cavity as micropapillary. Micropapillary ADCs typically develop in groups of papillae devoid of a fibrovascular core. These papillae are capable of adhering to the alveolar wall or shedding into the alveolar gap. Clusters of exfoliated tumour cells may resemble alveolar macrophage aggregates. During the labelling procedure, micropapillary ADC and macrophage clusters cannot be clearly separated. Therefore, the model may incorrectly recognise tissue cell clusters as micropapillary components, resulting in an inaccurate proportion. In the situation depicted in figure 5C, the micropapillary component should be the predominant subtype. Instead, the model revealed a negligible number of micropapillary components. Theoretically, micropapillary components in a hollow surrounded by lepidic, acinar and papillary patterns should be categorised as micropapillary ADCs.3 However, since the model works merely based on morphology, internal micropapillary components are typically overcome by exterior micropapillary components, resulting in diminished detection of micropapillary components.
Figure 5D illustrates the false positive examples encountered during this investigation. According to the model prediction, acinar components are located in the upper left and lower right sides of the WSI. These regions contain no malignant tumours, with morphology that differs slightly from that of a healthy lung. At low magnification, the alveolar wall in these regions is severely collapsed and there is apparent tissue extrusion, which is distinct from normal lung tissue. The vascular walls within this region are thin and lined with a single flat epithelium. This appearance is comparable to that of acinar ADC, thus the model has made an error. The reason may be that such occurrences are uncommon during the labelling process and the vessels are not clearly labelled.
Our study has several limitations. First, the specimens included in this study are surgically resected specimens, which may only represent a limited part of lung ADC in practical clinical practice, and the performance of this diagnostic model in small biopsies cannot be determined at present. Second, artefacts caused by iatrogenic atelectasis or other factors during surgical specimen processing may impact the accuracy of AI recognition. Third, due to the incomplete sampling of tumour resection specimens for pathological evaluation, most cases in the study were evaluated using representative evaluation without complete evaluation of the entire tumour, except for small tumours. Fourth, there may be inconsistencies among pathologists in their understanding of the invasion and grading of lung ADC. The model labelling in this study only represents the participants in this study and may not necessarily reflect the opinions of other pathologists.
Despite the limitations, through the comparison of pathologists and model predictions, we discovered that the deep learning model is superior to humans in recognising tiny lesions. In figure 2C, the micropapillary component was ignored by the pathologist, whereas it was evident in the model prediction. The labelled region of the model was verified to be micropapillary ADC on review. The diagnosis is missed because the tissue component is minimal and intermingled with other subtypes. When there are too few micropapillary components and the tumour components are complex, a misdiagnosis may occur. Fortunately, the model not only has a strong capacity for recognising the primary subtypes but also a high sensitivity for recognising tiny ones. Due to the clinical significance of micropapillary ADC, accurate identification of micropapillary ADC is of great help to both pathologists and clinicians, as digital slides grow increasingly prevalent, the model will play an ever-larger role in daily diagnosis.
Conclusion
The proposed classification model of histopathological subtypes of non-mucinous lung ADC shows promise for clinical applications in a cost-effective and efficient manner. There is subjectivity and inconsistency in the classification of invasive non-mucinous ADC from WSIs for pathologists in clinical diagnosis, which could be relieved by AI-assisted systems. In the future study, we will build a framework to integrate diagnostic, quantitative analysis, and histological subtypes into a pipeline to improve the practical applicability.
Data availability statement
Data are available upon reasonable request.
Data availability statement
Data are available upon request to the corresponding authors.
Ethics statements
Patient consent for publication
Ethics approval
This study involves human participants and was approved by the Medical Ethics Committee, Beijing Chest Hospital, China (No. 2021-08). The informed consents were waived by the institutional review boards since the slides and reports were anonymised.
References
Footnotes
Contributors YZ, DZ, SW and NC proposed the research. YZ, DZ, YD, CZhang and NC performed the slide annotation. SH, MJ, CZhen, LW and SW wrote the deep learning code and performed the experiment. YZ, DZ, SH, MJ and CZhen wrote the manuscript. SW and NC reviewed the manuscript. NC was responsible for the overall content as guarantor.
Funding This work was supported by grants from the National Natural Science Foundation of China (grant number: 82072381), Beijing Municipal Science and Technology Project (grant numbers: Z181100001918027, Z191100006619079).
Competing interests SW is the cofounder and chief technology officer (CTO) of Thorough Future. LW is the algorithm researcher of Thorough Future. All remaining authors have declared no conflicts of interest.
Patient and public involvement Patients and/or the public were not involved in the design, or conduct, or reporting, or dissemination plans of this research.
Provenance and peer review Not commissioned; externally peer reviewed.