Article Text

Abstract
Objectives The measurement of visceral fat (VF) is clinically important for the identification of individuals at high risk of visceral obesity-related health conditions. Bioelectrical impedance analysis (BIA) is a widely available and frequently used body composition assessment method, but there have been few validation studies for the measurement of VF. This validation study investigated agreement between BIA and CT for the assessment of VF in adults.
Design Cross-sectional study.
Setting Between 2015 and 2016 in China.
Participants A total of 414 adults (119 men and 295 women) aged 40–82 years.
Primary and secondary outcome measures CT-visceral fat area (VFA) was derived at the L2-3 and umbilicus level and VFA cut-offs for visceral obesity applied. BIA measurements of visceral fat level were compared with CT VFA findings using scatter plots and receiver operator characteristic (ROC) curves.
Results Scatter plots showed poor agreement between BIA and CT-derived visceral fat measurements in both sexes (R=0.387–0.636). ROC curves gave optimum figures for sensitivity and specificity of 65% and 69% in women and 76% and 70% in men, respectively, for BIA to discriminate between adults with normal levels of VF and those with visceral obesity determined by CT.
Conclusion BIA has limited accuracy for the assessment of VF in adults in practice when compared with the criterion method.
- CT
- nutrition & dietetics
- public health
Data availability statement
The datasets generated and/or analyzed during the current study are available from the Prof. Xiaoguang Cheng on reasonable request.
This is an open access article distributed in accordance with the Creative Commons Attribution Non Commercial (CC BY-NC 4.0) license, which permits others to distribute, remix, adapt, build upon this work non-commercially, and license their derivative works on different terms, provided the original work is properly cited, appropriate credit is given, any changes made indicated, and the use is non-commercial. See: http://creativecommons.org/licenses/by-nc/4.0/.
Statistics from Altmetric.com
Strengths and limitations of this study
The agreement of bioelectrical impedance analysis (BIA) with CT for the assessment of visceral fat and abdominal obesity in adults was poor.
We found improved visceral fat level thresholds in men and women compared to the manufacturer’s recommendation.
In this study, the BIA device was single frequency and therefore findings cannot be generalised to multifrequency BIA devices.
Introduction
An excess of visceral adipose tissue (VAT) can cause metabolic abnormalities, through the secretion of harmful inflammatory adipokines such as interleukin-6, tumour necrosis factor-alpha and macrophage chemoattractant protein-1.1 In particular, visceral fat increases the risk for development of chronic low-grade inflammation and is involved in the pathogenesis of numerous inflammatory medical conditions including metabolic syndrome, diabetes and cardiovascular disease,2–4 as well as being an important, independent predictor of all-cause mortality.4 5 It is therefore clinically important to identify individuals with high levels of visceral fat, so that appropriate interventions can implemented.
Proxy measures of excess fat accumulation such as body mass index (BMI) and waist circumference have been demonstrated to be largely ineffective in identifying visceral obesity, although waist-to-height ratio has shown promise.6 7 The gold standard methods for the measurement of visceral fat are CT and MRI. Visceral fat area (VFA) based on single-slice imaging of CT/MRI is widely used in research studies8 9 but rarely used in clinical practice. Several studies have provided cut-off values of VFA for visceral obesity assessment in Japanese, Korean and Chinese populations,10–12 recognising a greater amount of visceral adiposity at any given BMI in East Asian populations compared with other ethnic groups like white population, African Caribbean black population and Hispanics.13 However, CT and MRI are limited in large-scale studies or in clinical protocols, due to cost, availability and radiation exposure.
Bioelectrical impedance analysis (BIA) is a widely available, low-cost and non-X-ray-based method, and is used frequently in clinical practice and research settings to evaluate total body water and body composition. There have been few validation studies of BIA-derived assessments of visceral fat,14 15 and no study has yet investigated BIA-estimates in accord with CT-derived visceral obesity reference cut-points. Therefore, the aim of this study was to investigate agreement between single-frequency BIA and abdominal CT for the assessment of visceral fat and visceral obesity in Chinese adults.
Materials and methods
Study participants
Participants were recruited from community-based population samples of the Changzhou region from the Prospective Urban Rural Epidemiology China Action on Spine and Hip status study.16 The inclusion criterion and exclusion criterion have been described previously.16 In addition, for this study, individuals who had hydration abnormalities such as visible oedema, cirrhosis or heart failure were excluded from the study. The overall study population included 414 adults, comprising 119 males (age range: 40–82 years) and 295 females (age range: 44–81 years).
Anthropometry
Anthropometry, BIA and CT assessments were performed during the same appointment for each participant. Height and weight were measured using calibrated equipment (HW-900Y, Lejia Tech Corp) with participants wearing underwear and barefoot. BMI was calculated as weight (kg) divided by height squared (metre). A BMI of ≤24 kg/m2 was considered normal weight and >24 kg/m2 was defined as overweight/obesity.17
Quantitative CT abdominal fat area
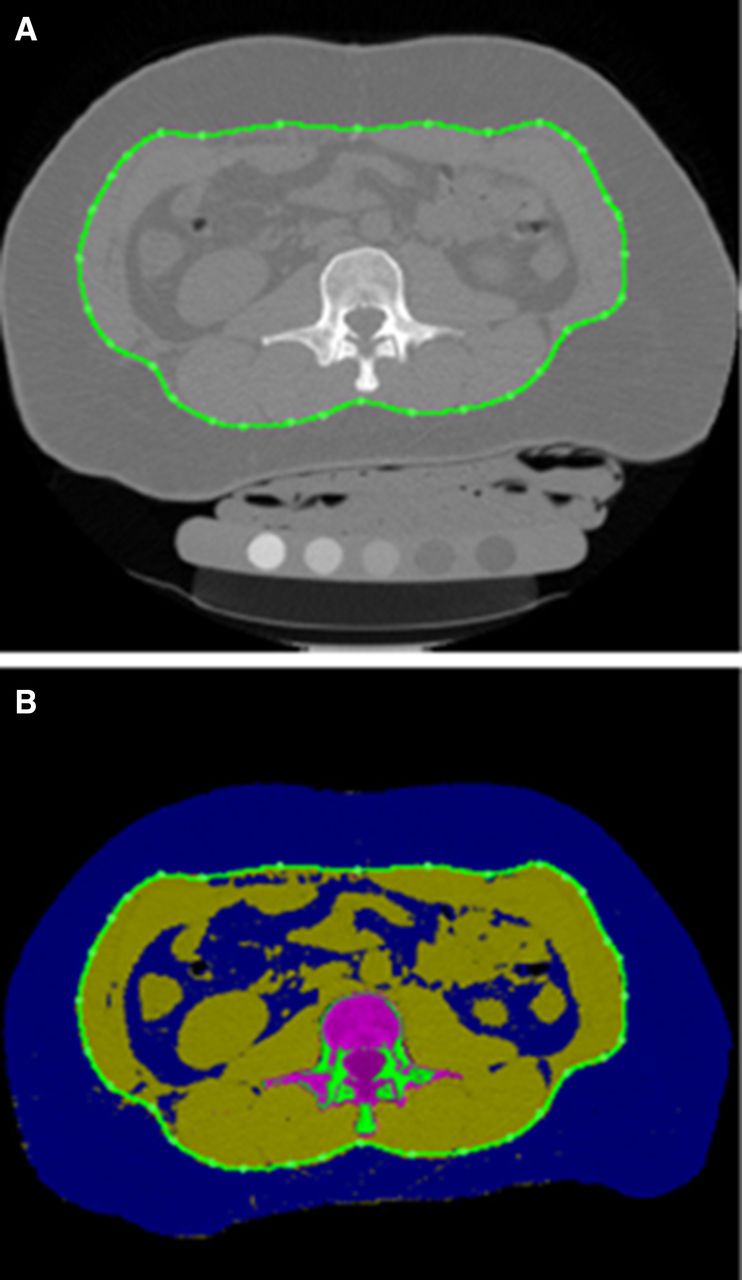
Abdominal CT scans were performed on a Siemens Somatom Definition AS+64 slice dual energy CT scanner. The scanning range was from superior margin level of T12 vertebral body to L5 inferior margin. Scanning parameters were 120 KV, 125 mAs, 500 mm field of view, 1-mm slice thickness, matrix 512×512, table height 154 cm. All participants were positioned supine on the CT table, and a quantitative CT (QCT) calibration phantom (Mindways, Austin, TX, USA) was placed beneath the body. All original DICOM images were transferred to QCT analysis software (QCT PRO 5.0) workstation in Beijing Jishuitan Hospital and converted into QCT documents. The tissue composition module was used to measure total fat area (TFA) and VFA at L2-L3 intervertebral space (figure 1A,B) and umbilicus cross-section level. Details of adipose tissue measurements have been reported previously.18 In brief, adipose tissue was segmented and mapped in blue with a default threshold, and the outer contour of abdominal wall was then outlined by the software automatically on each 1 mm-thick slice. All measurements were carried out by two trained and experienced radiologists (CY and RY). The interobserver and intraobserver reliabilities of QCT VFA measurements were good with intraclass correlation coefficient 0.996 and 0.990,8 respectively.

(A) Quantitative CT fat image of the abdomen. (B) Segmentation results in the fat map: abdomen fat is shown in blue colour and visceral adipose tissue is shown by the green contour.
BIA body composition
Body composition was estimated using whole-body, upright, single-frequency (SF)-BIA (Tanita BC-554, Tanita Corp, Tokyo, Japan). All participants were measured in lightweight clothing and standing barefoot on the metal footpads. To measure the bio-impedance, a very low, safe electrical signal is sent from four metal electrodes through the feet to the legs and abdomen. The Tanita BIA uses a SF-BIA at 50 kHz which predominately measures extracellular water and approximately 25% of intracellular water. Participant information entered into the system to enable the computing of the BIA algorithms, included gender, age, height and weight. Body fat mass percentage (BF) and visceral fat level (VFL) were recorded as the mean value of two repeated measurements. The time interval between the BIA and QCT measurements did not exceed 7 days. The Tanita body composition analyser gave a range of VFL rating between 1 and 59. According to the manufacturer’s information, a rating between 1 and 12 indicates a healthy level of visceral fat, whereas a rating between 13 and 59 indicates excess visceral fat. The reproducibility of estimated values using this BIA system have been reported previously.18 19
Statistical analysis
Statistical analyses were performed using SPSS V.25.0 software (IBM, Armonk, NY, USA) and R V.3.6.2 (R Core Team, R Foundation for Statistical Computing, Vienna, Austria). The measurement data are presented as the mean±SD. The Mann-Whitney U test was used for intergroup and subgroup comparisons of baseline characteristics. Spearman’s rank correlation coefficients were used to evaluate whether VFL was correlated with other parameters. Pearson correlation coefficients were determined among the anthropometric parameters, body fat variables measured by CT and BF. A correlogram was used to plot a graph of correlation matrix. In this plot, correlation coefficients were coloured and sized according to the value. Statistical analyses were performed to assess the prevalence of visceral obesity based on BIA VFL (VFL >13) and VFA (VFA >142 cm2 for men and 115 cm2 for women at L2/3 level; VFA >111 cm2 for men and 96 cm2 for women at the umbilical level)12 by CT. Scatter plots of VFL against VFA were drawn and receiver operator characteristic (ROC) curves used to determine the sensitivity and specificity for BIA measurements to discriminate between adults with normal levels of visceral fat and those with visceral obesity determined by CT. p<0.05 was considered statistically significant.
Patients and public involvement
Patients and the public were not involved in this study, including data collection, analysis and interpretation.
Results
Anthropometric, body fat percentage and visceral fat parameters are shown in table 1. There were significant differences in height, weight, BMI, body fat percentage, VFL and VFA between women and men.
Characteristics of the study population
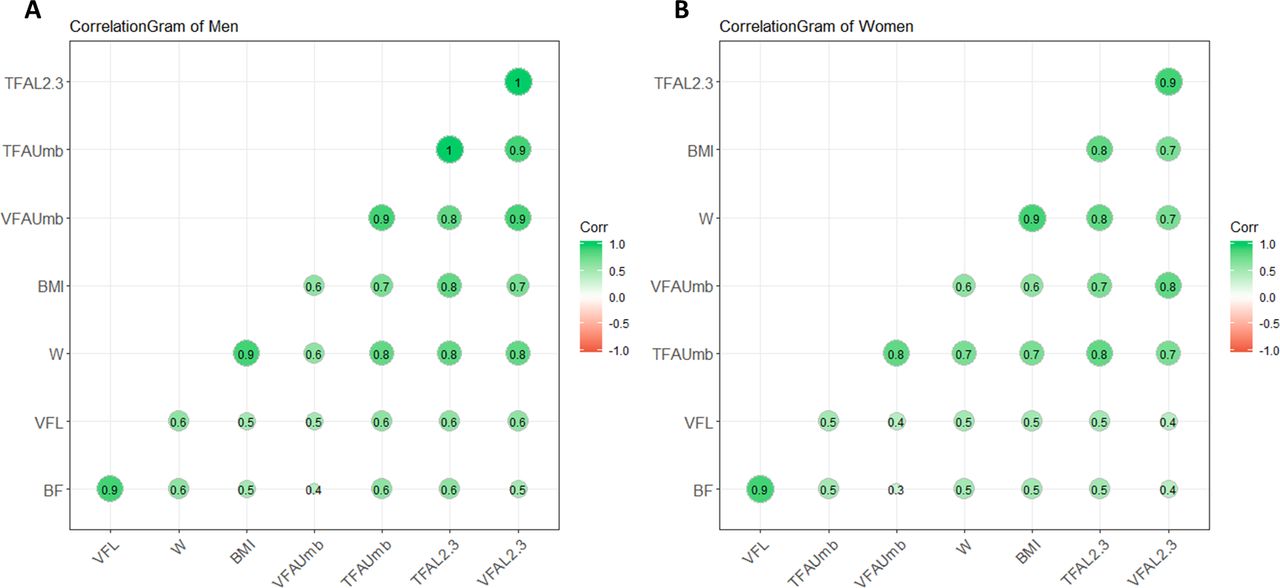
Figure 2 shows the plots of correlation matrix of body fat composition variables and anthropometric measurements in men (figure 2A) and women (figure 2B). VFL was poorly correlated with VFA and TFA at L2/3 and umbilicus level (R=0.387–0.636, all p<0.001) in both genders. The correlation between VFL and BF was good in both sexes (R=0.851 for women and 0.894 for men, p<0.001). BMI and weight showed higher associations (R=0.586–0.762, all p<0.001) with VFA than VFL (R=0.384–0.565, all p<0.001). Total body fat percentage was poorly associated with VFA and TFA at both levels (R=0.335–0.506, all p<0.001).

Correlation matrix diagram of fat variables, weight and BMI in (A) men and (B) women. Correlation coefficients are coloured and sized according to the value. Note: the correlation coefficients between TFA L2.3 and VFA L2.3 in (A), as well as TFA L2.3 and TFA Umb, are not 1 but 0.951 and 0.958, respectively. All correlations were significant (p<0.001). bf, body fat percent; BMI, body mass index; L2.3, lumber 2/3 level; TFA, total fat area; Umb, umbilicus; VFA, visceral fat area; VFL, visceral fat level; W, weight.
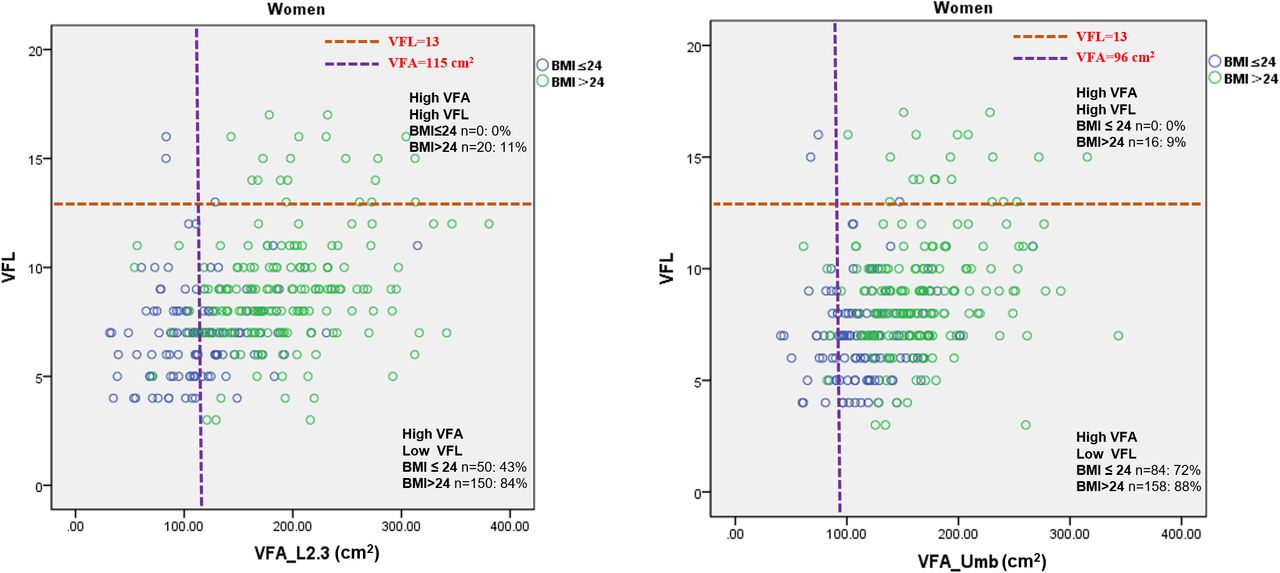
Table 2 shows BIA and CT-derived fat mass results for normal weight and overweight/obesity subgroups. Significant differences (p<0.001) were found between overweight/obesity and normal weight subgroups for all body fat composition parameters in both sexes (table 2). Figures 3 and 4 demonstrate the level of agreement between BIA and CT for the identification of visceral obesity in women and men, stratified by BMI, respectively. Approximately 10% of overweight/obese women and no normal-weight women were correctly identified as having high levels of visceral fat by BIA. Conversely, CT imaging identified high levels of visceral fat in 40% of normal-weight women. In overweight/obese men, the agreement between BIA and CT was slightly better, with BIA correctly identifying 50% of men with visceral obesity in the overweight/obese group. While in normal-weight men, BIA only correctly identified 5% of men with visceral obesity.

Plots of VFL and VFA at L2/3 and umbilicus levels in women. Visceral obesity: visceral fat area determined by CT >115 cm2 at L2/3 and >96 cm2 at umbilicus level. Percentage was defined as number of subjects in the quadrant/number of subjects in related BMI group. BMI, body mass index; L2.3, lumber 2/3 level; Umb, umbilicus; VFA, visceral fat area; VFL, visceral fat level.

Plots of VFL and VFA at L2/3 and umbilicus levels in men. Visceral obesity: visceral fat area determined by CT >142 cm2 at L2/3 and >111 cm2 at umbilicus level. Percentage was defined as number of subjects in the quadrant/number of subjects in the related BMI group. BMI, body mass index; L2.3, lumber 2/3 level; Umb, umbilicus; VFA, visceral fat area; VFL, visceral fat level.
Characteristics of the study population stratified by BMI
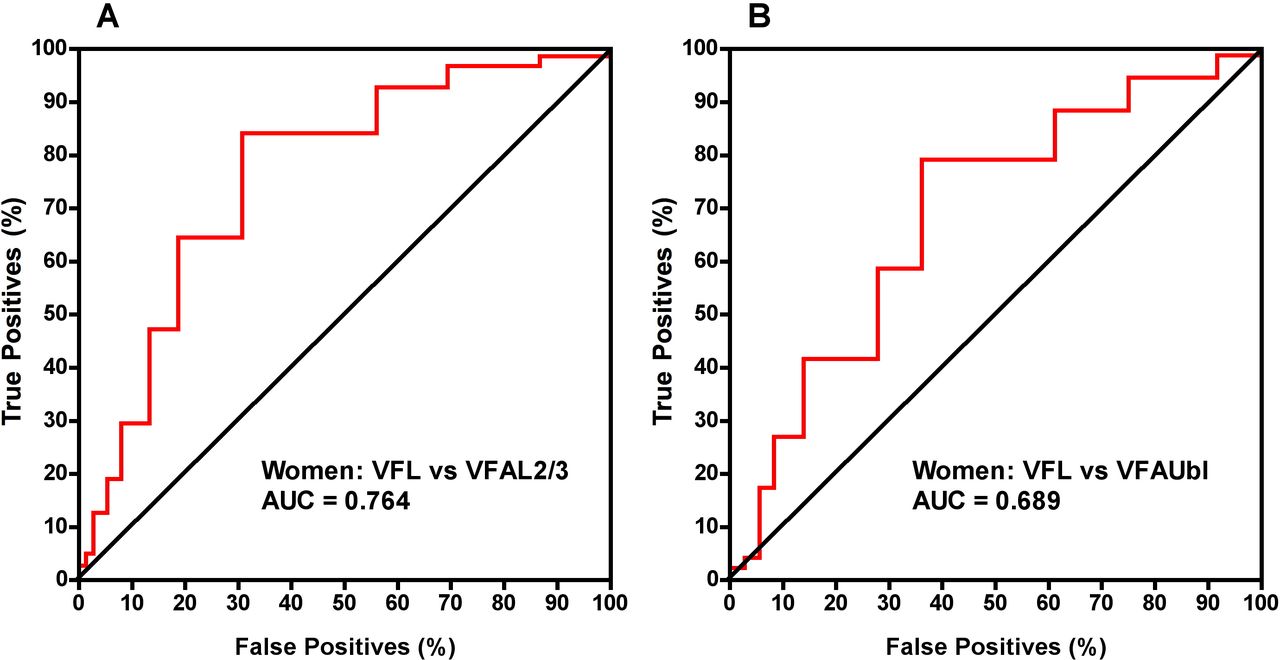
Figures 5 and 6 show the corresponding ROC curves. A BIA VFL threshold of 8 gave 65% sensitivity and 69% specificity for identifying women with VAT >115 cm2 at L2/3. A BIA threshold of 12 gave 76% sensitivity and 70% specificity for identifying men with VAT >142 cm2 at L2/3. Overall there was poor agreement between the two methods for the assessment of visceral obesity.

ROC curves for the plots of VFL and VFA at L2/3 and umbilicus levels in women in figure 3. Positive and negative cases of obesity in women were defined by reference to the VFA thresholds in figure 3. L2/3, lumber 2/3 level; ROC, receiver operator characteristic; VFA, visceral fat area; VFL, visceral fat level.

ROC curves for the plots of VFL and VFA at L2/3 and umbilicus levels in men in figure 4. Positive and negative cases of obesity in men were defined by reference to the VFA thresholds in figure 4. L2/3, lumber 2/3 level; ROC, receiver operator characteristic; VFA, visceral fat area; VFL, visceral fat level
Discussion
Abdominal adipose tissue can be measured accurately using the state-of-art imaging techniques such as CT. However, due to increased ionising radiation and high-cost, CT is inappropriate for the measurement and monitoring of abdominal visceral fat in many research and clinical situations. As such, BIA, as a more widely available and low-cost body composition tool is more feasible, at least in clinical practice. However, we found poor agreement between BIA and CT for the measurement of visceral fat. The correlation coefficients (R=0.387–0.636) for visceral fat between BIA and CT in this study (figure 2A,B) are similar to those reported elsewhere between BIA and MRI (r2=0.13–0.44).15 At the manufacturer’s recommended VFL threshold of 13 the sensitivity and specificity of BIA measurements to discriminate visceral obesity measured by CT VFA were 10% and 97%, respectively, in women and 52% and 90% in men. However, we found improved figures for sensitivity and specificity by choosing different VFL thresholds in men and women.
Another study using two whole-body BIA devices and one abdominal BIA device found that agreement between all three BIA devices for visceral fat assessment was better for total fat mass than for visceral fat in both men and women.20 There has been some recent interest in the potential of locally applied BIA for the quantification of abdominal subcutaneous fat thickness.21 In addition, two previous studies have reported positive correlations between BIA-derived visceral fat measures and metabolic parameters including blood pressure, lipid profiles and fasting glucose.22 23 However, it should be considered that the correlation coefficients for visceral fat and metabolic parameters in these studies are relatively low (R=0.2–0.4) and interestingly, the correlation coefficients were better for waist circumference.22 23
Unlike CT, BIA does not provide a direct measure of fat tissue.24 BIA most closely estimates body water and there is no direct theoretical relationship between resistance and/or reactance and relative body fatness.25 The estimation of adiposity from BIA is instead based on empirical relationships from samples of experimental subjects and calculations involve assumptions at several steps.26 Given the uncertainties surrounding the BIA-VFL calculation process, the significant disagreement between BIA and CT for defining visceral obesity requires further exploration.
We recognise several limitations to this study. First, it should be considered that we did not include measurements of waist circumference or waist-to-height ratio, of which the latter has been found to be highly correlated with visceral fat mass using dual-energy X-ray absorptiometry.7 BMI is used to assess general obesity, while waist circumference is used to assess abdominal obesity. Therefore, it might be better to do the analyses of figures 3 and 4 stratified by waist circumference rather than BMI. Second, in this study, the BIA device was single frequency and therefore findings cannot be generalised to multifrequency BIA devices. Notably, different types of BIA equipment on the market include SF and multifrequency devices, which vary in price. The instrument (Tanita BC-554) used in this study is a consumer-grade instrument and relatively inexpensive (US$170) compared with professional-grade instruments (>US$1000). It is important to acknowledge the wide range of variability in the accuracy of BIA scales and the comparative validities of SF and multifrequency BIA devices has also been questioned.26
Conclusion
The agreement of BIA with the criterion method, CT, for the assessment of visceral fat and abdominal obesity in adults was poor. Further studies are warranted to improve the predictive value of abdominal BIA relative to the gold standard of CT/MRI, before BIA should be accepted for the definition of visceral obesity in practice.
Data availability statement
The datasets generated and/or analyzed during the current study are available from the Prof. Xiaoguang Cheng on reasonable request.
Ethics statements
Patient consent for publication
Ethics approval
This study was approved by the Research Ethics Committee of Beijing Jishuitan Hospital, and written informed consent was provided by all participants (approval number no. 201512-02).
References
Footnotes
Contributors Study design: CH, ZX and XC; study conduct: CH and ZX; data collection: XC, YL, CY, RY and LM; data analysis: YL and LX; data interpretation: ZG and AY;
manuscript drafting: CH, ZX, YL, XC, GG and KH; approving final version of manuscript: all authors.
Funding This study was supported by the National Natural Science Foundation of China (grant no. 81771831);the Beijing Natural Science Foundation project (grant number: 17L20188) and the Beijing Municipal Administration of Hospitals Clinical Medicine Development of Special Funding Support (code: XMLX201843).
Competing interests None declared.
Patient and public involvement Patients and/or the public were not involved in the design, or conduct, or reporting, or dissemination plans of this research.
Provenance and peer review Not commissioned; externally peer reviewed.